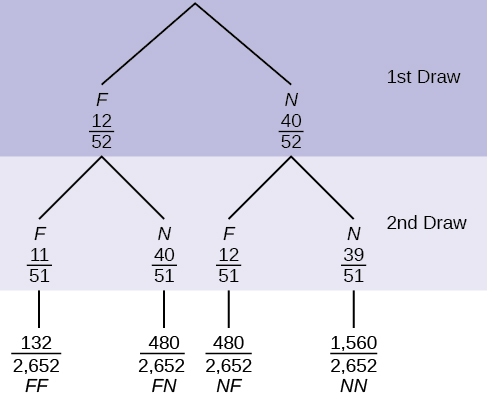
In a standard deck, there are 52 cards. Twelve cards are face cards (
F ) and 40 cards are not face cards (
N ). Draw two cards, one at a time, without replacement. The tree diagram is labeled with all possible probabilities.
Find
P (
FN OR
NF ).
Find
P (
N |
F ).
Find
P (at most one face card).
Hint: "At most one face card" means zero or one face card.
Find
P (at least on face card).
Hint: "At least one face card" means one or two face cards.
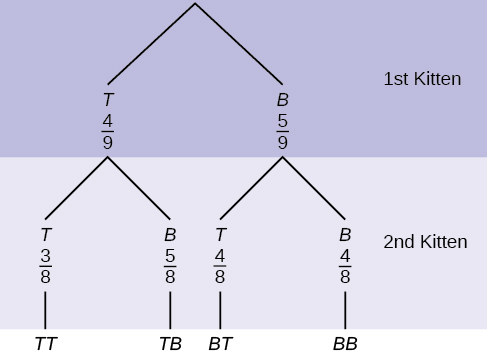
A litter of kittens available for adoption at the Humane Society has four tabby kittens and five black kittens. A family comes in and randomly selects two kittens (without replacement) for adoption.
What is the probability that both kittens are tabby?
a.
b.
c.
d.
What is the probability that one kitten of each coloring is selected?
a.
b.
c.
d.
What is the probability that a tabby is chosen as the second kitten when a black kitten was chosen as the first?
What is the probability of choosing two kittens of the same color?
Suppose there are four red balls and three yellow balls in a box. Three balls are drawn from the box without replacement. What is the probability that one ball of each coloring is selected?
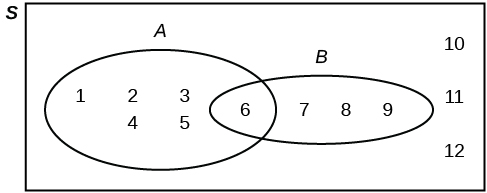
A
Venn diagram is a picture that represents the outcomes of an experiment. It generally consists of a box that represents the sample space S together with circles or ovals. The circles or ovals represent events.
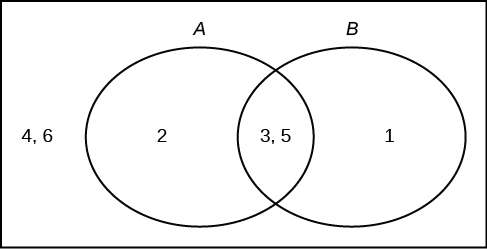
Suppose an experiment has the outcomes 1, 2, 3, ... , 12 where each outcome has an equal chance of occurring. Let event
A = {1, 2, 3, 4, 5, 6} and event
B = {6, 7, 8, 9}. Then
A AND
B = {6} and
A OR
B = {1, 2, 3, 4, 5, 6, 7, 8, 9}. The Venn diagram is as follows:
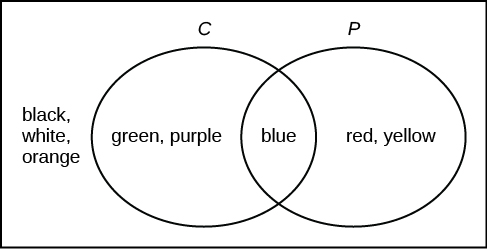
Suppose an experiment has outcomes black, white, red, orange, yellow, green, blue, and purple, where each outcome has an equal chance of occurring. Let event
C = {green, blue, purple} and event
P = {red, yellow, blue}. Then
C AND
P = {blue} and
C OR
P = {green, blue, purple, red, yellow}. Draw a Venn diagram representing this situation.
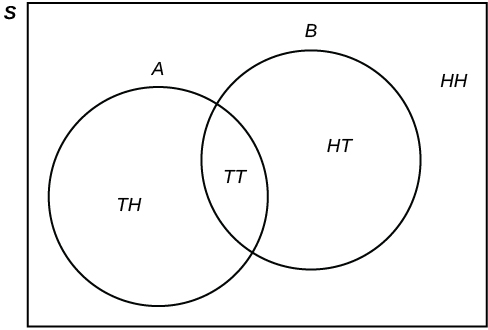
Flip two fair coins. Let
A = tails on the first coin. Let
B = tails on the second coin. Then
A = {
TT ,
TH } and
B = {
TT ,
HT }. Therefore,
A AND
B = {
TT }.
A OR
B = {
TH ,
TT ,
HT }.
The sample space when you flip two fair coins is
X = {
HH ,
HT ,
TH ,
TT }. The outcome
HH is in NEITHER
A NOR
B . The Venn diagram is as follows:
Roll a fair, six-sided die. Let
A = a prime number of dots is rolled. Let
B = an odd number of dots is rolled. Then
A = {2, 3, 5} and
B = {1, 3, 5}. Therefore,
A AND
B = {3, 5}.
A OR
B = {1, 2, 3, 5}. The sample space for rolling a fair die is
S = {1, 2, 3, 4, 5, 6}. Draw a Venn diagram representing this situation.
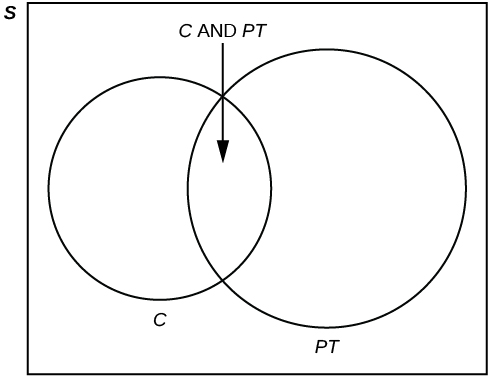
Forty percent of the students at a local college belong to a club and
50% work part time.
Five percent of the students work part time and belong to a club. Draw a Venn diagram showing the relationships. Let
C = student belongs to a club and
PT = student works part time.
If a student is selected at random, find
the probability that the student belongs to a club.
P (
C ) = 0.40
the probability that the student works part time.
P (
PT ) = 0.50
the probability that the student belongs to a club AND works part time.
P (
C AND
PT ) = 0.05
the probability that the student belongs to a club
given that the student works part time.
the probability that the student belongs to a club
OR works part time.
P (
C OR
PT ) =
P (
C ) +
P (
PT ) -
P (
C AND
PT ) = 0.40 + 0.50 - 0.05 = 0.85
is it possible to leave every good at the same level
Joseph
I don't think so. because check it, if the demand for chicken increases, people will no longer consume fish like they used to causing a fall in the demand for fish
Anuolu
is not really possible to let the value of a goods to be same at the same time.....
Salome
Suppose the inflation rate is 6%, does it mean that all the goods you purchase will cost
6% more than previous year? Provide with reasoning.
Not necessarily. To measure the inflation rate economists normally use an averaged price index of a basket of certain goods. So if you purchase goods included in the basket, you will notice that you pay 6% more, otherwise not necessarily.
Good day
How do I calculate this question: C= 100+5yd G= 2000 T= 2000 I(planned)=200.
Suppose the actual output is 3000. What is the level of planned expenditures at this level of output?
I am Camara from Guinea west Africa... happy to meet you guys here
Sekou
ma management ho
Amisha
ahile becheclor ho
Amisha
hjr ktm bta ho
ani k kaam grnu hunxa tw
Amisha
belatari
Amisha
1st year ho
Amisha
nd u
Amisha
ahh
Amisha
kaha biratnagar
Amisha
ys
Amisha
kina k vo
Amisha
money as unit of account means what?
Kalombe
A unit of account is something that can be used to value goods and services and make calculations
Jim
all of you please speak in English I can't understand you're language
Muhammad
I want to know how can we define macroeconomics in one line
Muhammad
it must be .9 or 0.9
no Mpc is greater than 1
Y=100+.9Y+50
Y-.9Y=150
0.1Y/0.1=150/0.1
Y=1500
Kalombe
Mercy is it clear?😋
Kalombe
hi can someone help me on this question
If a negative shocks shifts the IS curve to the left, what type of policy do you suggest so as to stabilize the level of output?
discuss your answer using appropriate graph.