-
Home
- Introductory statistics
- Introductory statistics
- Notes for the ti-83, 83+, 84,
To deselect equations:
-
Access the list of equations.

-
Select each equal sign (=).


- Continue, until all equations are deselected.
To clear equations:
-
Access the list of equations.
-
Use the arrow keys to navigate to the right of each equal sign (=) and clear them.

- Repeat until all equations are deleted.
To draw default histogram:
-
Access the ZOOM menu.

-
Select
<9:ZoomStat> .

- The histogram will show with a window automatically set.
To draw custom histogram:
- Access window mode to set the graph parameters.

-
-
-
-
(width of bars)
-
-
-
(spacing of tick marks on
y -axis)
-
- Access graphing mode to see the histogram.

To draw box plots:
-
Access graphing mode.
 ,
,
[STAT PLOT]
-
Select
<1:Plot 1> to access the first graph.
-
Use the arrows to select
<ON> and turn on Plot 1.
-
Use the arrows to select the box plot picture and enable it.
- Use the arrows to navigate to
<Xlist> .
-
If "L1" is not selected, select it.
,
[L1] ,
- Use the arrows to navigate to
<Freq> .
-
Indicate that the frequencies are in
[L2] .
,
[L2] ,
-
Go back to access other graphs.
,
[STAT PLOT]
-
Be sure to deselect or clear all equations before graphing using the method mentioned above.
-
View the box plot.
,
[STAT PLOT]
Linear regression
Sample data
The following data is real. The percent of declared ethnic minority students at De Anza College for selected years from 1970–1995 was:
| Year |
Student Ethnic Minority Percentage |
| 1970 |
14.13 |
| 1973 |
12.27 |
| 1976 |
14.08 |
| 1979 |
18.16 |
| 1982 |
27.64 |
| 1983 |
28.72 |
| 1986 |
31.86 |
| 1989 |
33.14 |
| 1992 |
45.37 |
| 1995 |
53.1 |
The independent variable is "Year," while the independent variable is "Student Ethnic Minority Percent."
Student ethnic minority percentage
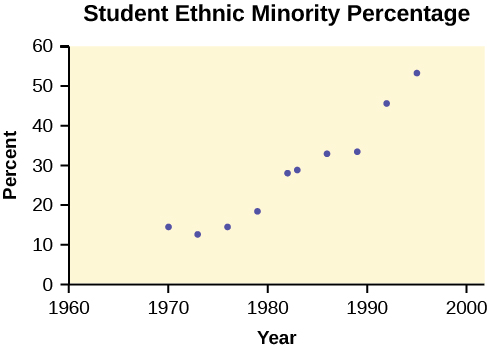 By hand, verify the scatterplot above.
Note
The TI-83 has a built-in linear regression feature, which allows the data to be edited.The
x -values will be in
[L1] ; the
y -values in
[L2] .
To enter data and do linear regression:
-
ON Turns calculator on.

- Before accessing this program, be sure to turn off all plots.
- Round to three decimal places. To do so:
-
Access the mode menu.
 ,
,
[STAT PLOT]
-
Navigate to
<Float> and then to the right to
<3> .
-
All numbers will be rounded to three decimal places until changed.
-
Enter statistics mode and clear lists
[L1] and
[L2] , as describe previously.
 ,
,

-
Enter editing mode to insert values for
x and
y .
,
- Enter each value. Press
to continue.
To display the correlation coefficient:
-
Access the catalog.
,
[CATALOG]
-
Arrow down and select
<DiagnosticOn>
... ,
,
-
and
will be displayed during regression calculations.
-
Access linear regression.
-
Select the form of
y =
a +
bx .
 ,
,
The display will show:
Linreg
-
y =
a +
bx
-
a = –3176.909
-
b = 1.617
-
r = 2 0.924
-
r = 0.961
This means the Line of Best Fit (Least Squares Line) is:
-
y = –3176.909 + 1.617
x
- Percent = –3176.909 + 1.617 (year #)
The correlation coefficient
r = 0.961
To see the scatter plot:
-
Access graphing mode.
,
[STAT PLOT]
-
Select
<1:plot 1> To access plotting - first graph.
-
Navigate and select
<ON> to turn on Plot 1.
<ON>
- Navigate to the first picture.
-
Select the scatter plot.
- Navigate to
<Xlist> .
- If
[L1] is not selected, press
,
[L1] to select it.
-
Confirm that the data values are in
[L1] .
<ON>
- Navigate to
<Ylist> .
-
Select that the frequencies are in
[L2] .
,
[L2] ,
-
Go back to access other graphs.
,
[STAT PLOT]
- Use the arrows to turn off the remaining plots.
- Access window mode to set the graph parameters.
-
-
-
(spacing of tick marks on
x -axis)
-
-
-
(spacing of tick marks on
y -axis)
-
- Be sure to deselect or clear all equations before graphing, using the instructions above.
- Press the graph button to see the scatter plot.
Questions & Answers
calculate molarity of NaOH solution when 25.0ml of NaOH titrated with 27.2ml of 0.2m H2SO4
the study of the heat energy which is associated with chemical reactions
Kaddija
How was CH4 and o2 was able to produce (Co2)and (H2o
First twenty elements with their valences
what is the best way to define periodic table for jamb
what is the change of matter from one state to another
what is isolation of organic compounds
Read Chapter 6, section 5
Dr
Read Chapter 6, section 5
Kareem
Atomic radius is the radius of the atom and is also called the orbital radius
Kareem
atomic radius is the distance between the nucleus of an atom and its valence shell
Amos
Read Chapter 6, section 5
paulino
Bohr's model of the theory atom
when a gas is compressed why it becomes hot?
ATOMIC
It has no oxygen then
Goldyei
read the chapter on thermochemistry...the sections on "PV" work and the First Law of Thermodynamics should help..
Dr
Which element react with water
an increase in the pressure of a gas results in the decrease of its
definition of the periodic table
what were atoms composed of?
Got questions? Join the online conversation and get instant answers!
Source:
OpenStax, Introductory statistics. OpenStax CNX. May 06, 2016 Download for free at http://legacy.cnx.org/content/col11562/1.18
Google Play and the Google Play logo are trademarks of Google Inc.