Home
Introductory statistics Introductory statistics
Notes for the ti-83, 83+, 84,
To deselect equations:
Access the list of equations.
Select each equal sign (=).
Continue, until all equations are deselected.
To clear equations:
Access the list of equations.
Use the arrow keys to navigate to the right of each equal sign (=) and clear them.
Repeat until all equations are deleted.
To draw default histogram:
Access the ZOOM menu.
Select
<9:ZoomStat> .
The histogram will show with a window automatically set.
To draw custom histogram:
Access window mode to set the graph parameters.
X
min
=
–2.5
X
max
=
3.5
X
s
c
l
=
1 (width of bars)
Y
min
=
0
Y
max
=
10
Y
s
c
l
=
1 (spacing of tick marks on
y -axis)
X
r
e
s
=
1
Access graphing mode to see the histogram.
To draw box plots:
Access graphing mode.
,
[STAT PLOT]
Select
<1:Plot 1> to access the first graph.
Use the arrows to select
<ON> and turn on Plot 1.
Use the arrows to select the box plot picture and enable it.
Use the arrows to navigate to
<Xlist> .
If "L1" is not selected, select it.
,
[L1] ,
Use the arrows to navigate to
<Freq> .
Indicate that the frequencies are in
[L2] .
,
[L2] ,
Go back to access other graphs.
,
[STAT PLOT]
Be sure to deselect or clear all equations before graphing using the method mentioned above.
View the box plot.
,
[STAT PLOT]
Linear regression
Sample data
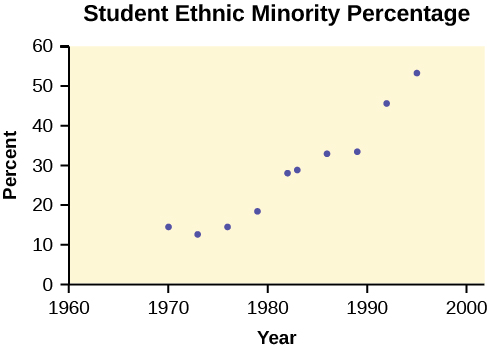
The following data is real. The percent of declared ethnic minority students at De Anza College for selected years from 1970–1995 was:
Year
Student Ethnic Minority Percentage
1970
14.13
1973
12.27
1976
14.08
1979
18.16
1982
27.64
1983
28.72
1986
31.86
1989
33.14
1992
45.37
1995
53.1
The independent variable is "Year," while the independent variable is "Student Ethnic Minority Percent."
Student ethnic minority percentage
By hand, verify the scatterplot above.
Note
The TI-83 has a built-in linear regression feature, which allows the data to be edited.The
x -values will be in
[L1] ; the
y -values in
[L2] .
To enter data and do linear regression:
ON Turns calculator on.
Before accessing this program, be sure to turn off all plots.
Round to three decimal places. To do so:
Access the mode menu.
,
[STAT PLOT]
Navigate to
<Float> and then to the right to
<3> .
All numbers will be rounded to three decimal places until changed.
Enter statistics mode and clear lists
[L1] and
[L2] , as describe previously.
,
Enter editing mode to insert values for
x and
y .
,
Enter each value. Press
to continue.
To display the correlation coefficient:
Access the catalog.
,
[CATALOG]
Arrow down and select
<DiagnosticOn>
... ,
,
r and
r
2 will be displayed during regression calculations.
Access linear regression.
Select the form of
y =
a +
bx .
,
Linreg
y =
a +
bx
a = –3176.909
b = 1.617
r = 2 0.924
r = 0.961
y = –3176.909 + 1.617
x
Percent = –3176.909 + 1.617 (year #) The correlation coefficient
r = 0.961
To see the scatter plot:
Access graphing mode.
,
[STAT PLOT]
Select
<1:plot 1> To access plotting - first graph.
Navigate and select
<ON> to turn on Plot 1.
<ON>
Navigate to the first picture.
Select the scatter plot.
Navigate to
<Xlist> .
If
[L1] is not selected, press
,
[L1] to select it.
Confirm that the data values are in
[L1] .
<ON>
Navigate to
<Ylist> .
Select that the frequencies are in
[L2] .
,
[L2] ,
Go back to access other graphs.
,
[STAT PLOT]
Use the arrows to turn off the remaining plots.
Access window mode to set the graph parameters.
X
min
=
1970
X
max
=
2000
X
s
c
l
=
10 (spacing of tick marks on
x -axis)
Y
min
=
−
0.05
Y
max
=
60
Y
s
c
l
=
10 (spacing of tick marks on
y -axis)
X
r
e
s
=
1
Be sure to deselect or clear all equations before graphing, using the instructions above.
Press the graph button to see the scatter plot.
Questions & Answers
Discuss the differences between taste and flavor, including how other sensory inputs contribute to our perception of flavor.
taste refers to your understanding of the flavor . while flavor one The other hand is refers to sort of just a blend things.
Faith
While taste primarily relies on our taste buds, flavor involves a complex interplay between taste and aroma
Kamara
which drugs can we use for ulcers
Omeprazole
Cimetidine / Tagament
For the complicated once ulcer - kit
Patrick
what is the function of lymphatic system
to drain extracellular fluid all over the body.
asegid
The lymphatic system plays several crucial roles in the human body, functioning as a key component of the immune system and contributing to the maintenance of fluid balance. Its main functions include:
1. Immune Response: The lymphatic system produces and transports lymphocytes, which are a type of
asegid
to transport fluids fats proteins and lymphocytes to the blood stream as lymph
Adama
Anatomy is the identification and description of the structures of living things
Kamara
what's the difference between anatomy and physiology
Anatomy is the study of the structure of the body, while physiology is the study of the function of the body. Anatomy looks at the body's organs and systems, while physiology looks at how those organs and systems work together to keep the body functioning.
AI-Robot
what is enzymes all about?
Enzymes are proteins that help speed up chemical reactions in our bodies. Enzymes are essential for digestion, liver function and much more. Too much or too little of a certain enzyme can cause health problems
Kamara
how does the stomach protect itself from the damaging effects of HCl
little girl okay how does the stomach protect itself from the damaging effect of HCL
Wulku
it is because of the enzyme that the stomach produce that help the stomach from the damaging effect of HCL
Kamara
function of digestive system
function of digestive
Ali
what is the normal body temperature
please why 37 degree selcius normal temperature
Mark
the normal temperature is 37°c or 98.6 °Fahrenheit is important for maintaining the homeostasis in the body
the body regular this temperature through the process called thermoregulation which involves brain skin muscle and other organ working together to maintain stable internal temperature
Stephanie
anaemia is the decrease in RBC count hemoglobin count and PVC count
Eniola
what is the pH of the vagina
how does Lysin attack pathogens
Diya
I information on anatomy position and digestive system and there enzyme
anatomy of the female external genitalia
Organ Systems Of The Human Body (Continued)
Organ Systems Of The Human Body (Continued)
what's lochia albra
Kizito
Got questions? Join the online conversation and get instant answers!
Source:
OpenStax, Introductory statistics. OpenStax CNX. May 06, 2016 Download for free at http://legacy.cnx.org/content/col11562/1.18
Google Play and the Google Play logo are trademarks of Google Inc.