Class Time: __________________________
Name: _____________________________________
H
0 : _______
H
a : _______
In words,
CLEARLY state what your random variable
or
represents.
State the distribution to use for the test.
What is the test statistic?
What is the
p -value? In one or two complete sentences, explain what the
p -value means for this problem.
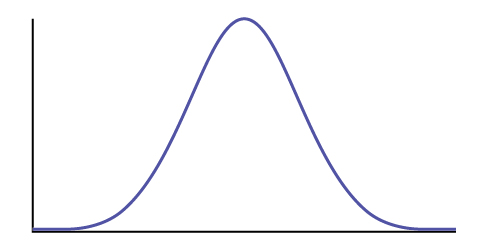
Use the previous information to sketch a picture of this situation. CLEARLY, label and scale the horizontal axis and shade the region(s) corresponding to the
p -value.
Indicate the correct decision (“reject” or “do not reject” the null hypothesis), the reason for it, and write an appropriate conclusion, using
complete sentences .
Alpha: _______
Decision: _______
Reason for decision: _______
Conclusion: _______
Construct a 95% confidence interval for the true mean or proportion. Include a sketch of the graph of the situation. Label the point estimate and the lower and upper bounds of the confidence interval.
Hypothesis testing with two samples
Class Time: __________________________
Name: _____________________________________
H
0 : _______
H
a : _______
In words,
clearly state what your random variable
,
or
represents.
State the distribution to use for the test.
What is the test statistic?
What is the
p -value? In one to two complete sentences, explain what the p-value means for this problem.
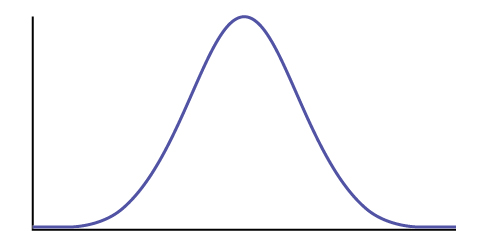
Use the previous information to sketch a picture of this situation.
CLEARLY label and scale the horizontal axis and shade the region(s) corresponding to the
p -value.
Indicate the correct decision (“reject” or “do not reject” the null hypothesis), the reason for it, and write an appropriate conclusion, using
complete sentences .
Alpha: _______
Decision: _______
Reason for decision: _______
Conclusion: _______
In complete sentences, explain how you determined which distribution to use.
The chi-square distribution
Class Time: __________________________
Name: ____________________________________
H
0 : _______
H
a : _______
What are the degrees of freedom?
State the distribution to use for the test.
What is the test statistic?
What is the
p -value? In one to two complete sentences, explain what the
p -value means for this problem.
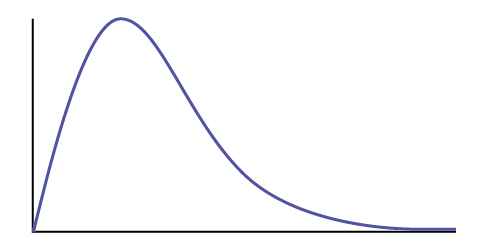
Use the previous information to sketch a picture of this situation.
Clearly label and scale the horizontal axis and shade the region(s) corresponding to the
p -value.
Indicate the correct decision (“reject” or “do not reject” the null hypothesis) and write appropriate conclusions, using
complete sentences.
Alpha: _______
Decision: _______
Reason for decision: _______
Conclusion: _______
F distribution and one-way anova
Class Time: __________________________
Name: ____________________________________
H
0 : _______
H
a : _______
df (
n ) = ______
df (
d ) = _______
State the distribution to use for the test.
What is the test statistic?
What is the
p -value?
Use the previous information to sketch a picture of this situation.
Clearly label and scale the horizontal axis and shade the region(s) corresponding to the
p -value.
Indicate the correct decision (“reject” or “do not reject” the null hypothesis) and write appropriate conclusions, using
complete sentences .
Evolution models refer to mathematical and computational representations of the processes involved in biological evolution. These models aim to simulate and understand how species change over time through mechanisms such as natural selection, genetic drift, and mutation. Evolutionary models can be u
faruk
what are the modern trends in religious behaviours
shared standards of acceptable behavior by the group or appropriate behavior in a particular institution or those behaviors that are acceptable in a society
Lucius
that is how i understood it
Lucius
examples of societal norms
Diamond
Discuss the characteristics of the research located within positivist and the interpretivist paradigm