

| << Chapter < Page | Chapter >> Page > |
“Metadata Description of Leadership PAC List.” Federal Election Commission. Available online at http://www.fec.gov/finance/disclosure/metadata/metadataLeadershipPacList.shtml (accessed July 2, 2013).
In many cases, the researcher does not know the population standard deviation, σ , of the measure being studied. In these cases, it is common to use the sample standard deviation, s , as an estimate of σ . The normal distribution creates accurate confidence intervals when σ is known, but it is not as accurate when s is used as an estimate. In this case, the Student’s t-distribution is much better. Define a t-score using the following formula:
The t -score follows the Student’s t-distribution with n – 1 degrees of freedom. The confidence interval under this distribution is calculated with EBM = where is the t -score with area to the right equal to , s is the sample standard deviation, and n is the sample size. Use a table, calculator, or computer to find for a given α .
s = the standard deviation of sample values.
is the formula for the t -score which measures how far away a measure is from the population mean in the Student’s t-distribution
df = n - 1; the degrees of freedom for a Student’s t-distribution where n represents the size of the sample
T ~ t df the random variable, T , has a Student’s t-distribution with df degrees of freedom
= the error bound for the population mean when the population standard deviation is unknown
is the t -score in the Student’s t-distribution with area to the right equal to
The general form for a confidence interval for a single mean, population standard deviation unknown, Student's t is given by (lower bound, upper bound)
= (point estimate –
EBM , point estimate +
EBM )
=
Use the following information to answer the next five exercises. A hospital is trying to cut down on emergency room wait times. It is interested in the amount of time patients must wait before being called back to be examined. An investigation committee randomly surveyed 70 patients. The sample mean was 1.5 hours with a sample standard deviation of 0.5 hours.
Identify the following:
Define the random variables X and in words.
X is the number of hours a patient waits in the emergency room before being called back to be examined. is the mean wait time of 70 patients in the emergency room.
Which distribution should you use for this problem?
Construct a 95% confidence interval for the population mean time spent waiting. State the confidence interval, sketch the graph, and calculate the error bound.
CI: (1.3808, 1.6192)
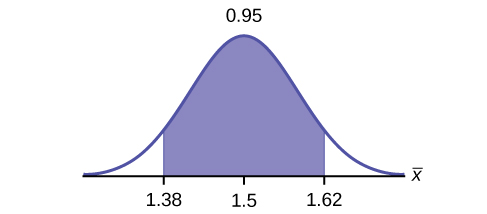
EBM = 0.12
Explain in complete sentences what the confidence interval means.
Use the following information to answer the next six exercises: One hundred eight Americans were surveyed to determine the number of hours they spend watching television each month. It was revealed that they watched an average of 151 hours each month with a standard deviation of 32 hours. Assume that the underlying population distribution is normal.
Identify the following:
Define the random variable X in words.
Define the random variable in words.
is the mean number of hours spent watching television per month from a sample of 108 Americans.
Which distribution should you use for this problem?
Construct a 99% confidence interval for the population mean hours spent watching television per month. (a) State the confidence interval, (b) sketch the graph, and (c) calculate the error bound.
CI: (142.92, 159.08)

EBM = 8.08
Why would the error bound change if the confidence level were lowered to 95%?
Use the following information to answer the next 13 exercises: The data in
[link] are the result of a random survey of 39 national flags (with replacement between picks) from various countries. We are interested in finding a confidence interval for the true mean number of colors on a national flag. Let
X = the number of colors on a national flag.
| X | Freq. |
|---|---|
| 1 | 1 |
| 2 | 7 |
| 3 | 18 |
| 4 | 7 |
| 5 | 6 |
Calculate the following:
Define the random variable in words.
Is known?
As a result of your answer to [link] , state the exact distribution to use when calculating the confidence interval.
t 38
Construct a 95% confidence interval for the true mean number of colors on national flags.
How much area is in both tails (combined)?
Calculate the following:
Fill in the blanks on the graph with the areas, the upper and lower limits of the Confidence Interval and the sample mean.
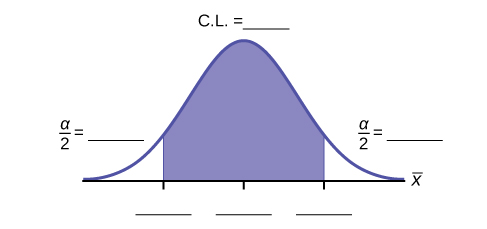
In one complete sentence, explain what the interval means.
We are 95% confident that the true mean number of colors for national flags is between 2.93 colors and 3.59 colors.
Using the same , , and level of confidence, suppose that n were 69 instead of 39. Would the error bound become larger or smaller? How do you know?
The error bound would become EBM = 0.245. This error bound decreases because as sample sizes increase, variability decreases and we need less interval length to capture the true mean.
Using the same , , and n = 39, how would the error bound change if the confidence level were reduced to 90%? Why?
Notification Switch
Would you like to follow the 'Introductory statistics' conversation and receive update notifications?

|
|
|
|
|

|
|

|
|

|
|

|
|

|
|

|
|

|
|

|
|
|
|
|

|