The student will calculate the 90% confidence interval the proportion of students in this school who were born in this state.
The student will interpret confidence intervals.
The student will determine the effects of changing conditions on the confidence interval.
Collect the data
Survey the students in your class, asking them if they were born in this state. Let
X = the number that were born in this state.
n = ____________
x = ____________
In words, define the random variable
P′ .
State the estimated distribution to use.
Find the confidence interval and error bound
Calculate the confidence interval and the error bound.
Confidence Interval: _____
Error Bound: _____
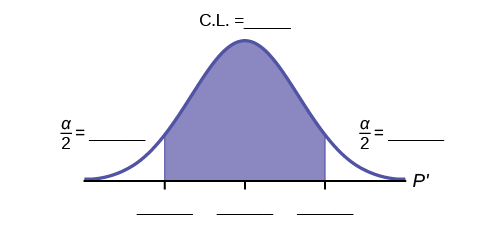
How much area is in both tails (combined)? α = _____
How much area is in each tail?
= _____
Fill in the blanks on the graph with the area in each section. Then, fill in the number line with the upper and lower limits of the confidence interval and the sample proportion.
Describe the confidence interval
In two to three complete sentences, explain what a confidence interval means (in general), as though you were talking to someone who has not taken statistics.
In one to two complete sentences, explain what this confidence interval means for this particular study.
Construct a confidence interval for each confidence level given.
Confidence level
EBP/Error Bound
Confidence Interval
50%
80%
95%
99%
What happens to the EBP as the confidence level increases? Does the width of the confidence interval increase or decrease? Explain why this happens.
Questions & Answers
Ayele, K., 2003. Introductory Economics, 3rd ed., Addis Ababa.
what's the difference between a firm and an industry
Abdul
firm is the unit which transform inputs to output where as industry contain combination of firms with similar production 😅😅
Abdulraufu
Suppose the demand function that a firm faces shifted from
Qd 120 3P
to
Qd 90 3P
and the supply function has shifted from
QS
20 2P
to
QS
10 2P .
a) Find the effect of this change on price and quantity.
b) Which of the changes in demand and supply is higher?
Demand curve shows that how supply and others conditions affect on demand of a particular thing and what percent demand increase whith increase of supply of goods
Israr
Hi Sir please how do u calculate Cross elastic demand and income elastic demand?
Abari
Got questions? Join the online conversation and get instant answers!