<< Chapter < Page Chapter >> Page >
Continuous Random Variable: Uniform Distribution is part of the collection col10555 written by Barbara Illowsky and Susan Dean. It describes the properties of the Uniform Distribution with contributions from Roberta Bloom.

The previous problem is an example of the uniform probability distribution .

Illustrate the uniform distribution . The data that follows are 55 smiling times, in seconds, of an eight-week old baby.

10.4 19.6 18.8 13.9 17.8 16.8 21.6 17.9 12.5 11.1 4.9
12.8 14.8 22.8 20.0 15.9 16.3 13.4 17.1 14.5 19.0 22.8
1.3 0.7 8.9 11.9 10.9 7.3 5.9 3.7 17.9 19.2 9.8
5.8 6.9 2.6 5.8 21.7 11.8 3.4 2.1 4.5 6.3 10.7
8.9 9.4 9.4 7.6 10.0 3.3 6.7 7.8 11.6 13.8 18.6

sample mean = 11.49 and sample standard deviation = 6.23

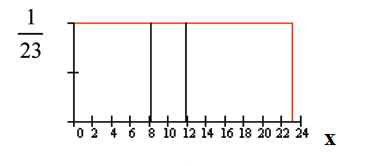
We will assume that the smiling times, in seconds, follow a uniform distribution between 0 and 23 seconds, inclusive. This means that any smiling time from 0 to and including 23 secondsis equally likely . The histogram that could be constructed from the sample is an empirical distribution that closely matches the theoretical uniform distribution.

Let X = length, in seconds, of an eight-week old baby's smile.

The notation for the uniform distribution is

X ~ U ( a, b ) where a = the lowest value of x and b = the highest value of x .

The probability density function is f x = 1 b - a for a x b .

For this example, x ~ U ( 0, 23 ) and f x = 1 23 - 0 for 0 x 23 .

Formulas for the theoretical mean and standard deviation are

μ a + b 2 and σ ( b - a ) 2 12

For this problem, the theoretical mean and standard deviation are

μ 0 + 23 2 11.50 seconds and σ ( 23 - 0 ) 2 12 6.64 seconds

Notice that the theoretical mean and standard deviation are close to the sample mean and standard deviation.

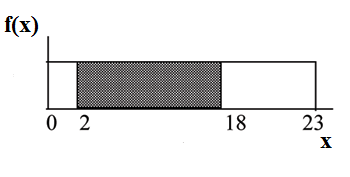
What is the probability that a randomly chosen eight-week old baby smiles between 2 and 18 seconds?

Find P ( 2 x 18 ) .

P ( 2 x 18 ) ( base ) ( height ) ( 18 - 2 ) 1 23 16 23 .

f(X) graph displaying a boxed region consisting of a horizontal line extending to the right from midway on the y-axis, a vertical upward line from point 23 on the x-axis, and the x and y-axes. A shaded region from points 2-18 occurs within this area.

Got questions? Get instant answers now!

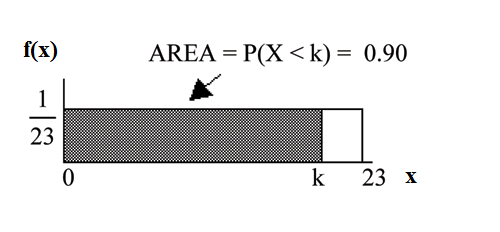
Find the 90th percentile for an eight week old baby's smiling time.

Ninety percent of the smiling times fall below the 90th percentile, k , so P ( x k ) 0.90

P ( x k ) 0.90

( base ) ( height ) = 0.90

( k - 0 ) 1 23 = 0.90

k 23 0.90 20.7

f(x)=1/23 graph displaying a boxed region consisting of a horizontal line extending to the right from point 1/23 on the y-axis, a vertical upward line from point 23 on the x-axis, and the x and y-axes. A shaded region from points 0-k occurs within this area. The shaded region probability area is equal to 0.90.

Got questions? Get instant answers now!

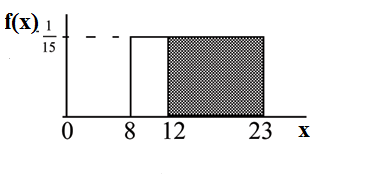
Find the probability that a random eight week old baby smiles more than 12 seconds KNOWING that the baby smiles MORE THAN 8 SECONDS .

Find P ( x 12 | x 8 ) There are two ways to do the problem. For the first way , use the fact that this is a conditional and changes the sample space. The graph illustrates the new sample space. You already know the baby smiled morethan 8 seconds.

Write a new f x : f x 1 23 - 8 1 15

for 8 x 23

P ( x 12 | x 8 ) ( 23 - 12 ) 1 15 11 15

f(X)=1/15 graph displaying a boxed region consisting of a horizontal line extending to the right from point 1/15 on the y-axis, a vertical upward line from points 8 and 23 on the x-axis, and the x-axis. A shaded region from points 12-23 occurs within this area.

For the second way, use the conditional formula from Probability Topics with the original distribution X ~ U ( 0 , 23 ) :

P ( A | B ) = P ( A AND B ) P ( B ) For this problem, A is ( x 12 ) and B is ( x 8 ) .

So, P ( x 12 | x 8 ) ( x > 12 AND x > 8 ) P ( x 8 ) P ( x 12 ) P ( x 8 ) 11 23 15 23 0.733

f(X)=1/23 graph displaying a conditional boxed region consisting of a horizontal red line extending to the right from point 1/23 on the y-axis, a vertical red upward line from point 23 on the x-axis, and the x and y-axes. Two vertical upward lines from points 8 and 12 on the x-axis occur within this area.

Got questions? Get instant answers now!

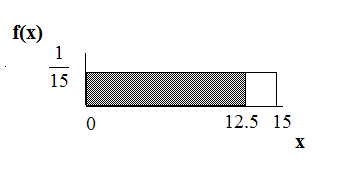
Uniform : The amount of time, in minutes, that a person must wait for a bus is uniformly distributed between 0 and 15 minutes, inclusive.

What is the probability that a person waits fewer than 12.5 minutes?

Let X = the number of minutes a person must wait for a bus. a = 0 and b = 15. x ~ U ( 0 , 15 ) . Write the probability density function. f x = 1 15 - 0 = 1 15 for 0 x 15 .

Find P ( x 12.5 ) . Draw a graph.

P ( x k ) ( base ) ( height ) = ( 12.5 - 0 ) 1 15 = 0.8333

The probability a person waits less than 12.5 minutes is 0.8333.

f(X)=1/15 graph displaying a boxed region consisting of a horizontal line extending to the right from point 1/15 on the y-axis, a vertical upward line from point 15 on the x-axis, and the x and y-axes. A shaded region from points 0-12.5 occurs within this area.

Got questions? Get instant answers now!

On the average, how long must a person wait?

Find the mean, μ , and the standard deviation, σ .

μ = a + b 2 = 15 + 0 2 = 7.5 . On the average, a person must wait 7.5 minutes.

σ = ( b - a ) 2 12 = ( 15 - 0 ) 2 12 = 4.3 . The Standard deviation is 4.3 minutes.

Got questions? Get instant answers now!

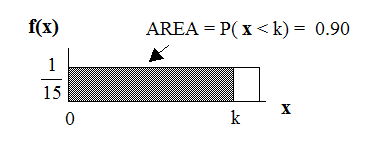
Ninety percent of the time, the time a person must wait falls below what value?

This asks for the 90th percentile.

Find the 90th percentile. Draw a graph. Let k = the 90th percentile.

P ( x k ) ( base ) ( height ) = ( k - 0 ) ( 1 15 )

0.90 = k 1 15

k = (0.90)(15) = 13.5

k is sometimes called a critical value.

The 90th percentile is 13.5 minutes. Ninety percent of the time, a person must wait at most 13.5 minutes.

f(X)=1/15 graph displaying a boxed region consisting of a horizontal line extending to the right from point 1/15 on the y-axis, a vertical upward line from an arbitrary point on the x-axis, and the x and y-axes. A shaded region from points 0-k occurs within this area. The area of this probability region is equal to 0.90.

Got questions? Get instant answers now!

Questions & Answers

Ayele, K., 2003. Introductory Economics, 3rd ed., Addis Ababa.
Widad Reply
can you send the book attached ?
Ariel
?
Ariel
What is economics
Widad Reply
the study of how humans make choices under conditions of scarcity
AI-Robot
U(x,y) = (x×y)1/2 find mu of x for y
Desalegn Reply
U(x,y) = (x×y)1/2 find mu of x for y
Desalegn
what is ecnomics
Jan Reply
this is the study of how the society manages it's scarce resources
Belonwu
what is macroeconomic
John Reply
macroeconomic is the branch of economics which studies actions, scale, activities and behaviour of the aggregate economy as a whole.
husaini
etc
husaini
difference between firm and industry
husaini Reply
what's the difference between a firm and an industry
Abdul
firm is the unit which transform inputs to output where as industry contain combination of firms with similar production 😅😅
Abdulraufu
Suppose the demand function that a firm faces shifted from Qd  120 3P to Qd  90  3P and the supply function has shifted from QS  20  2P to QS 10  2P . a) Find the effect of this change on price and quantity. b) Which of the changes in demand and supply is higher?
Toofiq Reply
explain standard reason why economic is a science
innocent Reply
factors influencing supply
Petrus Reply
what is economic.
Milan Reply
scares means__________________ends resources. unlimited
Jan
economics is a science that studies human behaviour as a relationship b/w ends and scares means which have alternative uses
Jan
calculate the profit maximizing for demand and supply
Zarshad Reply
Why qualify 28 supplies
Milan
what are explicit costs
Nomsa Reply
out-of-pocket costs for a firm, for example, payments for wages and salaries, rent, or materials
AI-Robot
concepts of supply in microeconomics
David Reply
economic overview notes
Amahle Reply
identify a demand and a supply curve
Salome Reply
i don't know
Parul
there's a difference
Aryan
Demand curve shows that how supply and others conditions affect on demand of a particular thing and what percent demand increase whith increase of supply of goods
Israr
Hi Sir please how do u calculate Cross elastic demand and income elastic demand?
Abari
Got questions? Join the online conversation and get instant answers!
Jobilize.com Reply
Practice Key Terms 2

Get Jobilize Job Search Mobile App in your pocket Now!

Get it on Google Play Download on the App Store Now


Source:  OpenStax, Collaborative statistics. OpenStax CNX. Jul 03, 2012 Download for free at http://cnx.org/content/col10522/1.40
Google Play and the Google Play logo are trademarks of Google Inc.

Notification Switch

Would you like to follow the 'Collaborative statistics' conversation and receive update notifications?

Ask