The formula for the standard deviation is at the end of the chapter.
Use the following data (first exam scores) from Susan Dean's spring pre-calculus class:
33
42
49
49
53
55
55
61
63
67
68
68
69
69
72
73
74
78
80
83
88
88
88
90
92
94
94
94
94
96
100
Create a chart containing the data, frequencies, relative frequencies, and cumulative relative frequencies to three decimal places.
Calculate the following to one decimal place using a TI-83+ or TI-84 calculator:
The sample mean
The sample standard deviation
The median
The first quartile
The third quartile
IQR
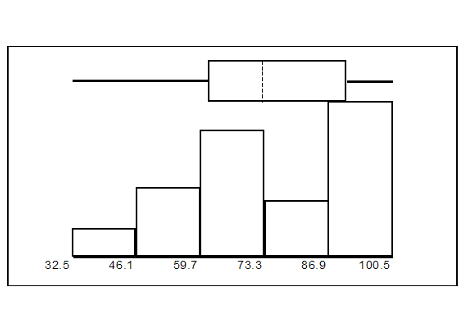
Construct a box plot and a histogram on the same set of axes. Make comments about the box plot, the histogram, and the chart.
Data
Frequency
Relative Frequency
Cumulative Relative Frequency
33
1
0.032
0.032
42
1
0.032
0.064
49
2
0.065
0.129
53
1
0.032
0.161
55
2
0.065
0.226
61
1
0.032
0.258
63
1
0.032
0.29
67
1
0.032
0.322
68
2
0.065
0.387
69
2
0.065
0.452
72
1
0.032
0.484
73
1
0.032
0.516
74
1
0.032
0.548
78
1
0.032
0.580
80
1
0.032
0.612
83
1
0.032
0.644
88
3
0.097
0.741
90
1
0.032
0.773
92
1
0.032
0.805
94
4
0.129
0.934
96
1
0.032
0.966
100
1
0.032
0.998 (Why isn't this value 1?)
The sample mean = 73.5
The sample standard deviation = 17.9
The median = 73
The first quartile = 61
The third quartile = 90
IQR = 90 - 61 = 29
The x-axis goes from 32.5 to 100.5; y-axis goes from -2.4 to 15 for the histogram; number of intervals is 5 for the histogram so the width of an interval is (100.5 - 32.5) divided by 5 which is equal to 13.6. Endpoints of the intervals: starting point is 32.5, 32.5+13.6 = 46.1, 46.1+13.6 = 59.7, 59.7+13.6 = 73.3, 73.3+13.6 = 86.9, 86.9+13.6 = 100.5 = the ending value; No data values fall on an interval boundary.
The long left whisker in the box plot is reflected in the left side of the histogram. The spread of the exam scores in the lower 50% is greater (73 - 33 = 40) than the spread in the upper 50% (100 - 73 = 27). The histogram, box plot, and chart all reflect this. There are a substantial number of A and B grades (80s, 90s, and 100). The histogram clearly shows this. The box plot shows us that the middle 50% of the exam scores (IQR = 29) are Ds, Cs, and Bs. The box plot also shows us that the lower 25% of the exam scores are Ds and Fs.
Comparing values from different data sets
The standard deviation is useful when comparing data values that come from different data sets. If the data sets have different means and standard deviations, it can be misleading to compare the data values directly.
For each data value, calculate how many standard deviations the value is away from its mean.
Use the formula: value = mean + (#ofSTDEVs)(standard deviation); solve for #ofSTDEVs.
Compare the results of this calculation.
#ofSTDEVs is often called a "z-score"; we can use the symbol z. In symbols, the formulas become:
Sample
=
+ z s
Population
=
+ z
Two students, John and Ali, from different high schools, wanted to find out who had the highest G.P.A. when compared to his school. Which student had the highest G.P.A. when compared to his school?
Student
GPA
School Mean GPA
School Standard Deviation
John
2.85
3.0
0.7
Ali
77
80
10
For each student, determine how many standard deviations (#ofSTDEVs) his GPA is away from the average, for his school. Pay careful attention to signs when comparing and interpreting the answer.
;
For John,
For Ali,
John has the better G.P.A. when compared to his school because his G.P.A. is 0.21 standard deviations
below his school's mean while Ali's G.P.A. is 0.3 standard deviations
below his school's mean.
John's z-score of −0.21 is higher than Ali's z-score of −0.3 . For GPA, higher values are better, so we conclude that John has the better GPA when compared to his school.
The following lists give a few facts that provide a little more insight into what the standard deviation tells us about the distribution of the data.
For any data set, no matter what the distribution of the data is:
At least 75% of the data is within 2 standard deviations of the mean.
At least 89% of the data is within 3 standard deviations of the mean.
At least 95% of the data is within 4 1/2 standard deviations of the mean.
This is known as Chebyshev's Rule.
For data having a distribution that is mound-shaped and symmetric:
Approximately 68% of the data is within 1 standard deviation of the mean.
Approximately 95% of the data is within 2 standard deviations of the mean.
More than 99% of the data is within 3 standard deviations of the mean.
This is known as the Empirical Rule.
It is important to note that this rule only applies when the shape of the distribution of the data is mound-shaped and symmetric. We will learn more about this when studying the "Normal" or "Gaussian" probability distribution in later chapters.
Bacteria doesn't produce energy they are dependent upon their substrate in case of lack of nutrients they are able to make spores which helps them to sustain in harsh environments
_Adnan
But not all bacteria make spores, l mean Eukaryotic cells have Mitochondria which acts as powerhouse for them, since bacteria don't have it, what is the substitution for it?
Assimilatory nitrate reduction is a process that occurs in some microorganisms, such as bacteria and archaea, in which nitrate (NO3-) is reduced to nitrite (NO2-), and then further reduced to ammonia (NH3).
Elkana
This process is called assimilatory nitrate reduction because the nitrogen that is produced is incorporated in the cells of microorganisms where it can be used in the synthesis of amino acids and other nitrogen products
There are nothing like emergency disease but there are some common medical emergency which can occur simultaneously like Bleeding,heart attack,Breathing difficulties,severe pain heart stock.Hope you will get my point .Have a nice day ❣️
_Adnan
define infection ,prevention and control
Innocent
I think infection prevention and control is the avoidance of all things we do that gives out break of infections and promotion of health practices that promote life