<< Chapter < Page Chapter >> Page >

Try it

Two samples are shown in [link] . Both have normal distributions. The means for the two populations are thought to be the same. Is there a difference in the means? Test at the 5% level of significance.

Sample Size Sample Mean Sample Standard Deviation
Population A 25 5 1
Population B 16 4.7 1.2

The p -value is 0.4125, which is much higher than 0.05, so we decline to reject the null hypothesis. There is not sufficient evidence to conclude that the means of the two populations are not the same.

Got questions? Get instant answers now!

Note

When the sum of the sample sizes is larger than 30 ( n 1 + n 2 >30) you can use the normal distribution to approximate the Student's t .

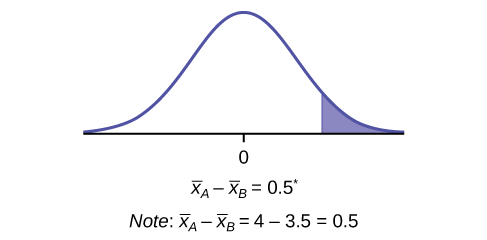
A study is done by a community group in two neighboring colleges to determine which one graduates students with more math classes. College A samples 11 graduates. Their average is four math classes with a standard deviation of 1.5 math classes. College B samples nine graduates. Their average is 3.5 math classes with a standard deviation of one math class. The community group believes that a student who graduates from college A has taken more math classes, on the average. Both populations have a normal distribution. Test at a 1% significance level. Answer the following questions.

a. Is this a test of two means or two proportions?

a. two means

Got questions? Get instant answers now!

b. Are the populations standard deviations known or unknown?

b. unknown

Got questions? Get instant answers now!

c. Which distribution do you use to perform the test?

c. Student's t

Got questions? Get instant answers now!

d. What is the random variable?

d. X ¯ A - X ¯ B

Got questions? Get instant answers now!

e. What are the null and alternate hypotheses? Write the null and alternate hypotheses in words and in symbols.

e.

  • H o : μ A μ B
  • H a : μ A > μ B

Got questions? Get instant answers now!

f. Is this test right-, left-, or two-tailed?

f.

This is a normal distribution curve with mean equal to 0. A vertical line near the tail of the curve to the right of zero extends from the axis to the curve. The region under the curve to the right of the line is shaded.

right

Got questions? Get instant answers now!

g. What is the p -value?

g. 0.1928

Got questions? Get instant answers now!

h. Do you reject or not reject the null hypothesis?

h. Do not reject.

Got questions? Get instant answers now!

i. Conclusion:

i. At the 1% level of significance, from the sample data, there is not sufficient evidence to conclude that a student who graduates from college A has taken more math classes, on the average, than a student who graduates from college B.

Got questions? Get instant answers now!

Try it

A study is done to determine if Company A retains its workers longer than Company B. Company A samples 15 workers, and their average time with the company is five years with a standard deviation of 1.2. Company B samples 20 workers, and their average time with the company is 4.5 years with a standard deviation of 0.8. The populations are normally distributed.

  1. Are the population standard deviations known?
  2. Conduct an appropriate hypothesis test. At the 5% significance level, what is your conclusion?
  1. They are unknown.
  2. The p -value = 0.0878. At the 5% level of significance, there is insufficient evidence to conclude that the workers of Company A stay longer with the company.
Got questions? Get instant answers now!

A professor at a large community college wanted to determine whether there is a difference in the means of final exam scores between students who took his statistics course online and the students who took his face-to-face statistics class. He believed that the mean of the final exam scores for the online class would be lower than that of the face-to-face class. Was the professor correct? The randomly selected 30 final exam scores from each group are listed in [link] and [link] .

Questions & Answers

how do you get the 2/50
Abba Reply
number of sport play by 50 student construct discrete data
Aminu Reply
width of the frangebany leaves on how to write a introduction
Theresa Reply
Solve the mean of variance
Veronica Reply
Step 1: Find the mean. To find the mean, add up all the scores, then divide them by the number of scores. ... Step 2: Find each score's deviation from the mean. ... Step 3: Square each deviation from the mean. ... Step 4: Find the sum of squares. ... Step 5: Divide the sum of squares by n – 1 or N.
kenneth
what is error
Yakuba Reply
Is mistake done to something
Vutshila
Hy
anas
hy
What is the life teble
anas
hy
Jibrin
statistics is the analyzing of data
Tajudeen Reply
what is statics?
Zelalem Reply
how do you calculate mean
Gloria Reply
diveving the sum if all values
Shaynaynay
let A1,A2 and A3 events be independent,show that (A1)^c, (A2)^c and (A3)^c are independent?
Fisaye Reply
what is statistics
Akhisani Reply
data collected all over the world
Shaynaynay
construct a less than and more than table
Imad Reply
The sample of 16 students is taken. The average age in the sample was 22 years with astandard deviation of 6 years. Construct a 95% confidence interval for the age of the population.
Aschalew Reply
Bhartdarshan' is an internet-based travel agency wherein customer can see videos of the cities they plant to visit. The number of hits daily is a normally distributed random variable with a mean of 10,000 and a standard deviation of 2,400 a. what is the probability of getting more than 12,000 hits? b. what is the probability of getting fewer than 9,000 hits?
Akshay Reply
Bhartdarshan'is an internet-based travel agency wherein customer can see videos of the cities they plan to visit. The number of hits daily is a normally distributed random variable with a mean of 10,000 and a standard deviation of 2,400. a. What is the probability of getting more than 12,000 hits
Akshay
1
Bright
Sorry i want to learn more about this question
Bright
Someone help
Bright
a= 0.20233 b=0.3384
Sufiyan
a
Shaynaynay
How do I interpret level of significance?
Mohd Reply
It depends on your business problem or in Machine Learning you could use ROC- AUC cruve to decide the threshold value
Shivam
how skewness and kurtosis are used in statistics
Owen Reply
yes what is it
Taneeya

Get Jobilize Job Search Mobile App in your pocket Now!

Get it on Google Play Download on the App Store Now


Source:  OpenStax, Introductory statistics. OpenStax CNX. May 06, 2016 Download for free at http://legacy.cnx.org/content/col11562/1.18
Google Play and the Google Play logo are trademarks of Google Inc.

Notification Switch

Would you like to follow the 'Introductory statistics' conversation and receive update notifications?

Ask