<< Chapter < Page Chapter >> Page >
A line provides Wavelength in nanometers for “400,” “500,” “600,” and “700” nanometers. Within this line are all of the colors of the visible spectrum. Below this line, labeled from left to right are “Cosmic radiation,” “Gamma rays,” “X-rays,” “Ultraviolet,” then a small callout area for the line above containing the colors in the visual spectrum, followed by “Infrared,” “Terahertz radiation,” “Radar,” “Television and radio broadcasting,” and “AC circuits.”
Different wavelengths of light are associated with our perception of different colors. (credit: modification of work by Johannes Ahlmann)

Sound waves

Like light waves, the physical properties of sound waves are associated with various aspects of our perception of sound. The frequency of a sound wave is associated with our perception of that sound’s pitch    . High-frequency sound waves are perceived as high-pitched sounds, while low-frequency sound waves are perceived as low-pitched sounds. The audible range of sound frequencies is between 20 and 20000 Hz, with greatest sensitivity to those frequencies that fall in the middle of this range.

As was the case with the visible spectrum, other species show differences in their audible ranges. For instance, chickens have a very limited audible range, from 125 to 2000 Hz. Mice have an audible range from 1000 to 91000 Hz, and the beluga whale’s audible range is from 1000 to 123000 Hz. Our pet dogs and cats have audible ranges of about 70–45000 Hz and 45–64000 Hz, respectively (Strain, 2003).

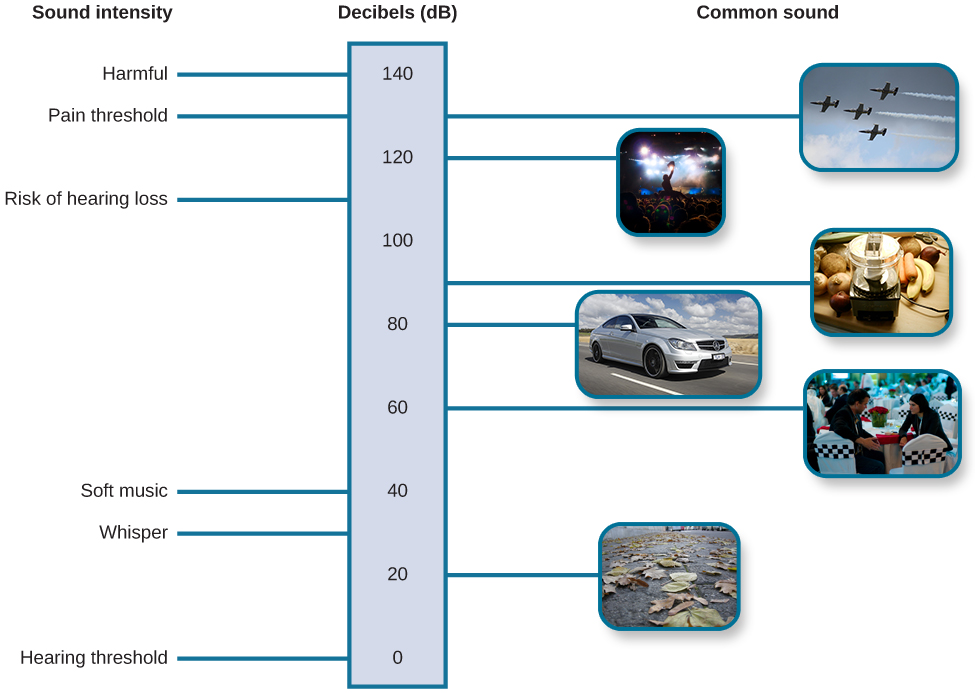
The loudness of a given sound is closely associated with the amplitude of the sound wave. Higher amplitudes are associated with louder sounds. Loudness is measured in terms of decibels (dB) , a logarithmic unit of sound intensity. A typical conversation would correlate with 60 dB; a rock concert might check in at 120 dB ( [link] ). A whisper 5 feet away or rustling leaves are at the low end of our hearing range; sounds like a window air conditioner, a normal conversation, and even heavy traffic or a vacuum cleaner are within a tolerable range. However, there is the potential for hearing damage from about 80 dB to 130 dB: These are sounds of a food processor, power lawnmower, heavy truck (25 feet away), subway train (20 feet away), live rock music, and a jackhammer. The threshold for pain is about 130 dB, a jet plane taking off or a revolver firing at close range (Dunkle, 1982).

This illustration has a vertical bar in the middle labeled Decibels (dB) numbered 0 to 140 in intervals of 20 from the bottom to the top. To the left of the bar, the “sound intensity” of different sounds is labeled: “Hearing threshold” is 0; “Whisper” is 30, “soft music” is 40, “Risk of hearing loss” is 110, “pain threshold” is 130, and “harmful” is 140. To the right of the bar are photographs depicting “common sound”: At 20 decibels is a picture of rustling leaves; At 60 is two people talking, at 80 is a car, at 90 is a food processor, at 120 is a music concert, and at 130 are jets.
This figure illustrates the loudness of common sounds. (credit "planes": modification of work by Max Pfandl; credit "crowd": modification of work by Christian Holmér; credit "blender": modification of work by Jo Brodie; credit "car": modification of work by NRMA New Cars/Flickr; credit "talking": modification of work by Joi Ito; credit "leaves": modification of work by Aurelijus Valeiša)

Although wave amplitude is generally associated with loudness, there is some interaction between frequency and amplitude in our perception of loudness within the audible range. For example, a 10 Hz sound wave is inaudible no matter the amplitude of the wave. A 1000 Hz sound wave, on the other hand, would vary dramatically in terms of perceived loudness as the amplitude of the wave increased.

Of course, different musical instruments can play the same musical note at the same level of loudness, yet they still sound quite different. This is known as the timbre of a sound. Timbre refers to a sound’s purity, and it is affected by the complex interplay of frequency, amplitude, and timing of sound waves.

Summary

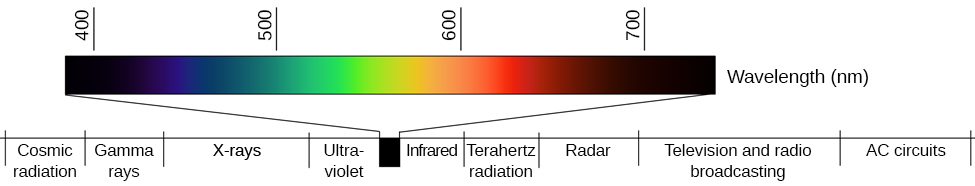
Both light and sound can be described in terms of wave forms with physical characteristics like amplitude, wavelength, and timbre. Wavelength and frequency are inversely related so that longer waves have lower frequencies, and shorter waves have higher frequencies. In the visual system, a light wave’s wavelength is generally associated with color, and its amplitude is associated with brightness. In the auditory system, a sound’s frequency is associated with pitch, and its amplitude is associated with loudness.

Personal application question

If you grew up with a family pet, then you have surely noticed that they often seem to hear things that you don’t hear. Now that you’ve read this section, you probably have some insight as to why this may be. How would you explain this to a friend who never had the opportunity to take a class like this?

Got questions? Get instant answers now!

Questions & Answers

What are the factors that affect demand for a commodity
Florence Reply
differentiate between demand and supply giving examples
Lambiv Reply
differentiated between demand and supply using examples
Lambiv
what is labour ?
Lambiv
how will I do?
Venny Reply
how is the graph works?I don't fully understand
Rezat Reply
information
Eliyee
devaluation
Eliyee
t
WARKISA
hi guys good evening to all
Lambiv
multiple choice question
Aster Reply
appreciation
Eliyee
explain perfect market
Lindiwe Reply
In economics, a perfect market refers to a theoretical construct where all participants have perfect information, goods are homogenous, there are no barriers to entry or exit, and prices are determined solely by supply and demand. It's an idealized model used for analysis,
Ezea
What is ceteris paribus?
Shukri Reply
other things being equal
AI-Robot
When MP₁ becomes negative, TP start to decline. Extuples Suppose that the short-run production function of certain cut-flower firm is given by: Q=4KL-0.6K2 - 0.112 • Where is quantity of cut flower produced, I is labour input and K is fixed capital input (K-5). Determine the average product of lab
Kelo
Extuples Suppose that the short-run production function of certain cut-flower firm is given by: Q=4KL-0.6K2 - 0.112 • Where is quantity of cut flower produced, I is labour input and K is fixed capital input (K-5). Determine the average product of labour (APL) and marginal product of labour (MPL)
Kelo
yes,thank you
Shukri
Can I ask you other question?
Shukri
what is monopoly mean?
Habtamu Reply
What is different between quantity demand and demand?
Shukri Reply
Quantity demanded refers to the specific amount of a good or service that consumers are willing and able to purchase at a give price and within a specific time period. Demand, on the other hand, is a broader concept that encompasses the entire relationship between price and quantity demanded
Ezea
ok
Shukri
how do you save a country economic situation when it's falling apart
Lilia Reply
what is the difference between economic growth and development
Fiker Reply
Economic growth as an increase in the production and consumption of goods and services within an economy.but Economic development as a broader concept that encompasses not only economic growth but also social & human well being.
Shukri
production function means
Jabir
What do you think is more important to focus on when considering inequality ?
Abdisa Reply
any question about economics?
Awais Reply
sir...I just want to ask one question... Define the term contract curve? if you are free please help me to find this answer 🙏
Asui
it is a curve that we get after connecting the pareto optimal combinations of two consumers after their mutually beneficial trade offs
Awais
thank you so much 👍 sir
Asui
In economics, the contract curve refers to the set of points in an Edgeworth box diagram where both parties involved in a trade cannot be made better off without making one of them worse off. It represents the Pareto efficient allocations of goods between two individuals or entities, where neither p
Cornelius
In economics, the contract curve refers to the set of points in an Edgeworth box diagram where both parties involved in a trade cannot be made better off without making one of them worse off. It represents the Pareto efficient allocations of goods between two individuals or entities,
Cornelius
Suppose a consumer consuming two commodities X and Y has The following utility function u=X0.4 Y0.6. If the price of the X and Y are 2 and 3 respectively and income Constraint is birr 50. A,Calculate quantities of x and y which maximize utility. B,Calculate value of Lagrange multiplier. C,Calculate quantities of X and Y consumed with a given price. D,alculate optimum level of output .
Feyisa Reply
Answer
Feyisa
c
Jabir
the market for lemon has 10 potential consumers, each having an individual demand curve p=101-10Qi, where p is price in dollar's per cup and Qi is the number of cups demanded per week by the i th consumer.Find the market demand curve using algebra. Draw an individual demand curve and the market dema
Gsbwnw Reply
suppose the production function is given by ( L, K)=L¼K¾.assuming capital is fixed find APL and MPL. consider the following short run production function:Q=6L²-0.4L³ a) find the value of L that maximizes output b)find the value of L that maximizes marginal product
Abdureman
Got questions? Join the online conversation and get instant answers!
Jobilize.com Reply

Get Jobilize Job Search Mobile App in your pocket Now!

Get it on Google Play Download on the App Store Now


Source:  OpenStax, Psychology. OpenStax CNX. Feb 03, 2015 Download for free at https://legacy.cnx.org/content/col11629/1.5
Google Play and the Google Play logo are trademarks of Google Inc.

Notification Switch

Would you like to follow the 'Psychology' conversation and receive update notifications?

Ask