How is the slope of a linear function similar to the derivative?
The slope of a linear function stays the same. The derivative of a general function varies according to
Both the slope of a line and the derivative at a point measure the rate of change of the function.
A car traveled 110 miles during the time period from 2:00
P.M. to 4:00
P.M. What was the car's average velocity? At exactly 2:30
P.M. , the speed of the car registered exactly 62 miles per hour. What is another name for the speed of the car at 2:30
P.M. ? Why does this speed differ from the average velocity?
Average velocity is 55 miles per hour. The instantaneous velocity at 2:30
p.m. is 62 miles per hour. The instantaneous velocity measures the velocity of the car at an instant of time whereas the average velocity gives the velocity of the car over an interval.
Suppose water is flowing into a tank at an average rate of 45 gallons per minute. Translate this statement into the language of mathematics.
The average rate of change of the amount of water in the tank is 45 gallons per minute. If
is the function giving the amount of water in the tank at any time
then the average rate of change of
between
and
is
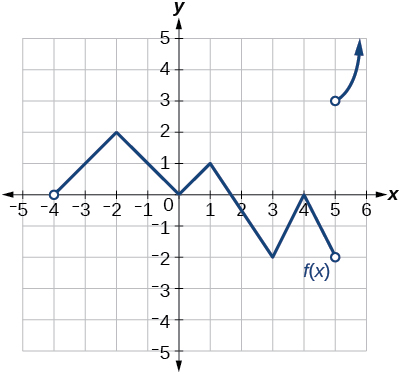
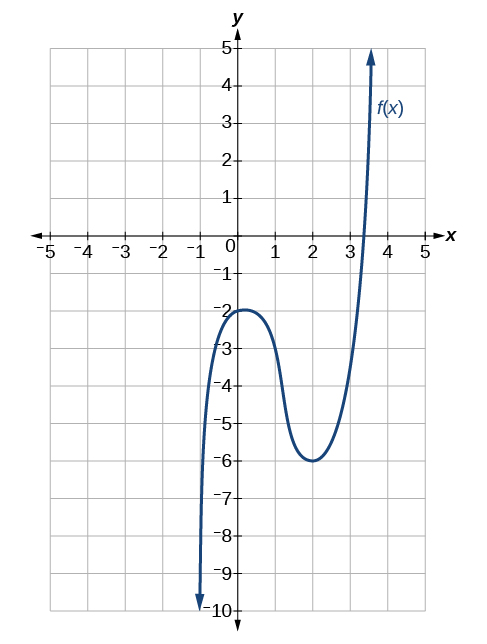
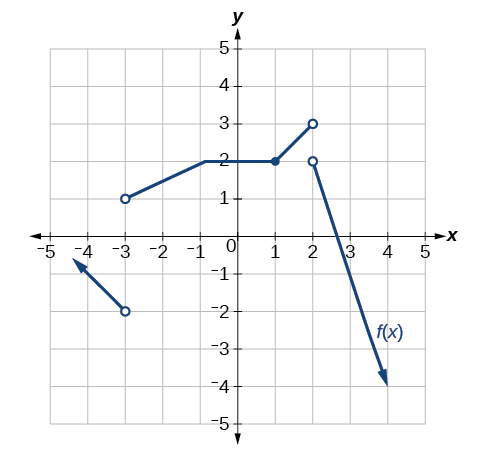
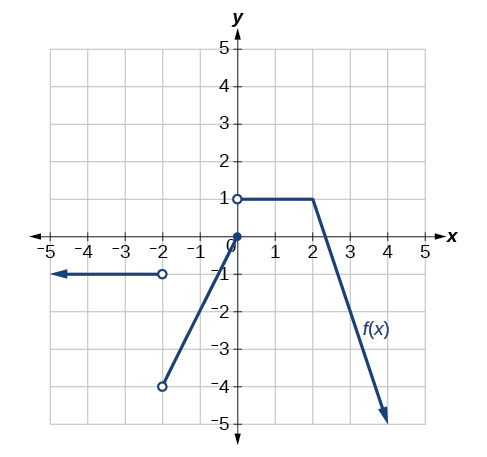
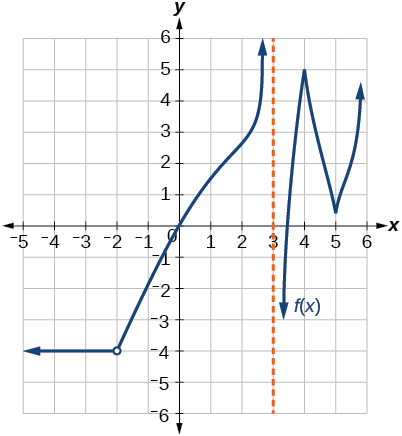
For the following exercises, consider the graph of the function
and determine where the function is continuous/discontinuous and differentiable/not differentiable.
Numerically evaluate the derivative. Explore the behavior of the graph of
around
by graphing the function on the following domains:
,
,
and
. We can use the feature on our calculator that automatically sets Ymin and Ymax to the Xmin and Xmax values we preset. (On some of the commonly used graphing calculators, this feature may be called ZOOM FIT or ZOOM AUTO). By examining the corresponding range values for this viewing window, approximate how the curve changes at
that is, approximate the derivative at
Answers vary. The slope of the tangent line near
is 2.
In economics, a perfect market refers to a theoretical construct where all participants have perfect information, goods are homogenous, there are no barriers to entry or exit, and prices are determined solely by supply and demand. It's an idealized model used for analysis,
When MP₁ becomes negative, TP start to decline.
Extuples Suppose that the short-run production function of certain cut-flower firm is given by: Q=4KL-0.6K2 - 0.112 •
Where is quantity of cut flower produced, I is labour input and K is fixed capital input (K-5). Determine the average product of lab
Kelo
Extuples Suppose that the short-run production function of certain cut-flower firm is given by: Q=4KL-0.6K2 - 0.112 •
Where is quantity of cut flower produced, I is labour input and K is fixed capital input (K-5). Determine the average product of labour (APL) and marginal product of labour (MPL)
Quantity demanded refers to the specific amount of a good or service that consumers are willing and able to purchase at a give price and within a specific time period. Demand, on the other hand, is a broader concept that encompasses the entire relationship between price and quantity demanded
Ezea
ok
Shukri
how do you save a country economic situation when it's falling apart
Economic growth as an increase in the production and consumption of goods and services within an economy.but
Economic development as a broader concept that encompasses not only economic growth but also social & human well being.
Shukri
production function means
Jabir
What do you think is more important to focus on when considering inequality ?
sir...I just want to ask one question... Define the term contract curve? if you are free please help me to find this answer 🙏
Asui
it is a curve that we get after connecting the pareto optimal combinations of two consumers after their mutually beneficial trade offs
Awais
thank you so much 👍 sir
Asui
In economics, the contract curve refers to the set of points in an Edgeworth box diagram where both parties involved in a trade cannot be made better off without making one of them worse off. It represents the Pareto efficient allocations of goods between two individuals or entities, where neither p
Cornelius
In economics, the contract curve refers to the set of points in an Edgeworth box diagram where both parties involved in a trade cannot be made better off without making one of them worse off. It represents the Pareto efficient allocations of goods between two individuals or entities,
Cornelius
Suppose a consumer consuming two commodities X and Y has
The following utility function u=X0.4 Y0.6. If the price of the X and Y are 2 and 3 respectively and income Constraint is birr 50.
A,Calculate quantities of x and y which maximize utility.
B,Calculate value of Lagrange multiplier.
C,Calculate quantities of X and Y consumed with a given price.
D,alculate optimum level of output .
the market for lemon has 10 potential consumers, each having an individual demand curve p=101-10Qi, where p is price in dollar's per cup and Qi is the number of cups demanded per week by the i th consumer.Find the market demand curve using algebra. Draw an individual demand curve and the market dema
suppose the production function is given by ( L, K)=L¼K¾.assuming capital is fixed find APL and MPL. consider the following short run production function:Q=6L²-0.4L³ a) find the value of L that maximizes output b)find the value of L that maximizes marginal product