

| << Chapter < Page | Chapter >> Page > |
Using the model in [link] , estimate the number of cases of flu on day 15.
895 cases on day 15
Now that we have discussed various mathematical models, we need to learn how to choose the appropriate model for the raw data we have. Many factors influence the choice of a mathematical model, among which are experience, scientific laws, and patterns in the data itself. Not all data can be described by elementary functions. Sometimes, a function is chosen that approximates the data over a given interval. For instance, suppose data were gathered on the number of homes bought in the United States from the years 1960 to 2013. After plotting these data in a scatter plot, we notice that the shape of the data from the years 2000 to 2013 follow a logarithmic curve. We could restrict the interval from 2000 to 2010, apply regression analysis using a logarithmic model, and use it to predict the number of home buyers for the year 2015.
Three kinds of functions that are often useful in mathematical models are linear functions, exponential functions, and logarithmic functions. If the data lies on a straight line, or seems to lie approximately along a straight line, a linear model may be best. If the data is non-linear, we often consider an exponential or logarithmic model, though other models, such as quadratic models, may also be considered.
In choosing between an exponential model and a logarithmic model, we look at the way the data curves. This is called the concavity. If we draw a line between two data points, and all (or most) of the data between those two points lies above that line, we say the curve is concave down. We can think of it as a bowl that bends downward and therefore cannot hold water. If all (or most) of the data between those two points lies below the line, we say the curve is concave up. In this case, we can think of a bowl that bends upward and can therefore hold water. An exponential curve, whether rising or falling, whether representing growth or decay, is always concave up away from its horizontal asymptote. A logarithmic curve is always concave away from its vertical asymptote. In the case of positive data, which is the most common case, an exponential curve is always concave up, and a logarithmic curve always concave down.
A logistic curve changes concavity. It starts out concave up and then changes to concave down beyond a certain point, called a point of inflection.
After using the graph to help us choose a type of function to use as a model, we substitute points, and solve to find the parameters. We reduce round-off error by choosing points as far apart as possible.
Does a linear, exponential, logarithmic, or logistic model best fit the values listed in [link] ? Find the model, and use a graph to check your choice.
| 1 | 2 | 3 | 4 | 5 | 6 | 7 | 8 | 9 | |
| 0 | 1.386 | 2.197 | 2.773 | 3.219 | 3.584 | 3.892 | 4.159 | 4.394 |
First, plot the data on a graph as in [link] . For the purpose of graphing, round the data to two significant digits.
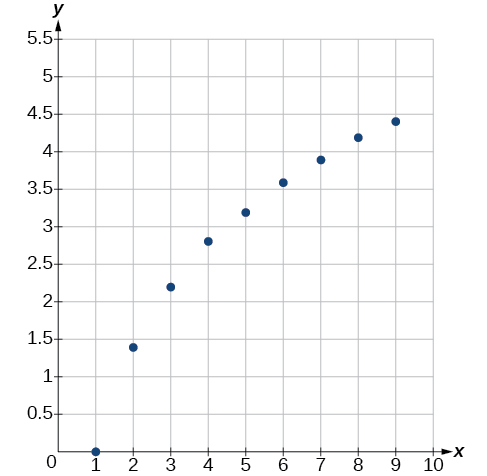
Clearly, the points do not lie on a straight line, so we reject a linear model. If we draw a line between any two of the points, most or all of the points between those two points lie above the line, so the graph is concave down, suggesting a logarithmic model. We can try Plugging in the first point, gives We reject the case that (if it were, all outputs would be 0), so we know Thus and Next we can use the point to solve for
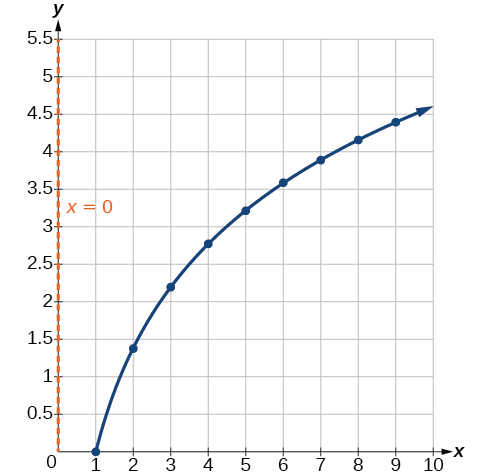
Because an appropriate model for the data is
To check the accuracy of the model, we graph the function together with the given points as in [link] .

We can conclude that the model is a good fit to the data.
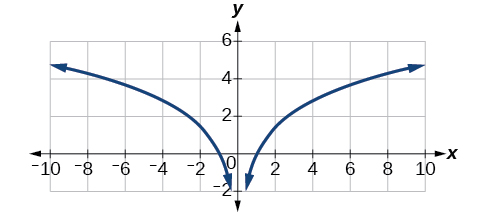
Compare [link] to the graph of shown in [link] .
The graphs appear to be identical when A quick check confirms this conclusion: for
However, if the graph of includes a “extra” branch, as shown in [link] . This occurs because, while cannot have negative values in the domain (as such values would force the argument to be negative), the function can have negative domain values.
Notification Switch
Would you like to follow the 'Precalculus' conversation and receive update notifications?

|
|
|
|
|

|
|

|
|

|
|

|
|

|
|

|
|

|
|

|
|

|
|

|