| << Chapter < Page | Chapter >> Page > |
It is the bottom of the ninth inning, with two outs and two men on base. The home team is losing by two runs. The batter swings and hits the baseball at 140 feet per second and at an angle of approximately to the horizontal. How far will the ball travel? Will it clear the fence for a game-winning home run? The outcome may depend partly on other factors (for example, the wind), but mathematicians can model the path of a projectile and predict approximately how far it will travel using parametric equations . In this section, we’ll discuss parametric equations and some common applications, such as projectile motion problems.

In lieu of a graphing calculator or a computer graphing program, plotting points to represent the graph of an equation is the standard method. As long as we are careful in calculating the values, point-plotting is highly dependable.
Given a pair of parametric equations, sketch a graph by plotting points.
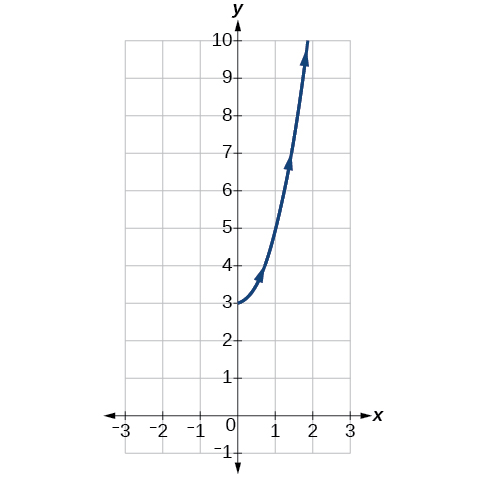
Sketch the graph of the parametric equations
Construct a table of values for and as in [link] , and plot the points in a plane.
The graph is a parabola with vertex at the point opening to the right. See [link] .
Construct a table of values for the given parametric equations and sketch the graph:
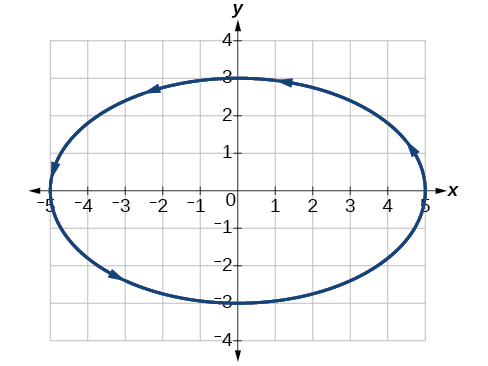
Construct a table like that in [link] using angle measure in radians as inputs for and evaluating and Using angles with known sine and cosine values for makes calculations easier.
| 0 | ||
[link] shows the graph.
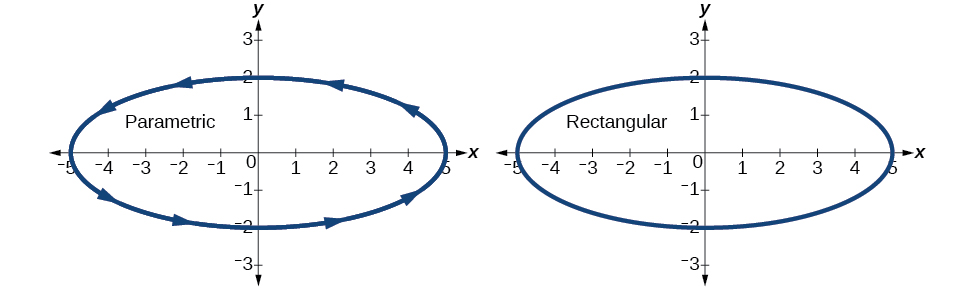
By the symmetry shown in the values of and we see that the parametric equations represent an ellipse . The ellipse is mapped in a counterclockwise direction as shown by the arrows indicating increasing values.
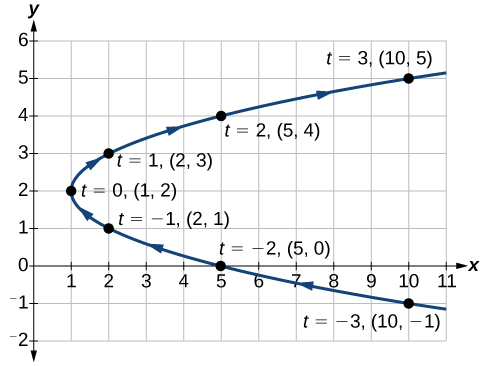
Graph the parametric equations and First, construct the graph using data points generated from the parametric form . Then graph the rectangular form of the equation. Compare the two graphs.
Construct a table of values like that in [link] .
Plot the values from the table. See [link] .
Next, translate the parametric equations to rectangular form. To do this, we solve for in either or and then substitute the expression for in the other equation. The result will be a function if solving for as a function of or if solving for as a function of
Then, use the Pythagorean Theorem .
Notification Switch
Would you like to follow the 'Precalculus' conversation and receive update notifications?

|
|

|
|

|
|

|
|

|
|

|
|

|
|

|
|
|
|
|

|
|

|