| << Chapter < Page | Chapter >> Page > |
The average teen in the United States opens a refrigerator door an estimated 25 times per day. Supposedly, this average is up from 10 years ago when the average teenager opened a refrigerator door 20 times per day http://www.csun.edu/science/health/docs/tv&health.html Source provided. .
It is estimated that a television is on in a home 6.75 hours per day, whereas parents spend an estimated 5.5 minutes per day having a meaningful conversation with their children. These averages, too, are not the same as they were 10 years ago, when the television was on an estimated 6 hours per day in the typical household, and parents spent 12 minutes per day in meaningful conversation with their kids.
What do these scenarios have in common? The functions representing them have changed over time. In this section, we will consider methods of computing such changes over time.
The functions describing the examples above involve a change over time. Change divided by time is one example of a rate. The rates of change in the previous examples are each different. In other words, some changed faster than others. If we were to graph the functions, we could compare the rates by determining the slopes of the graphs.
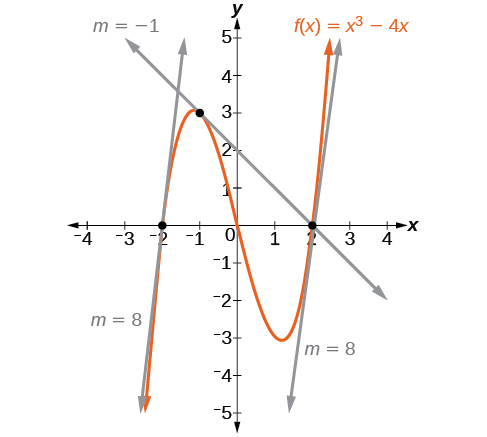
A tangent line to a curve is a line that intersects the curve at only a single point but does not cross it there. (The tangent line may intersect the curve at another point away from the point of interest.) If we zoom in on a curve at that point, the curve appears linear, and the slope of the curve at that point is close to the slope of the tangent line at that point.
[link] represents the function We can see the slope at various points along the curve.

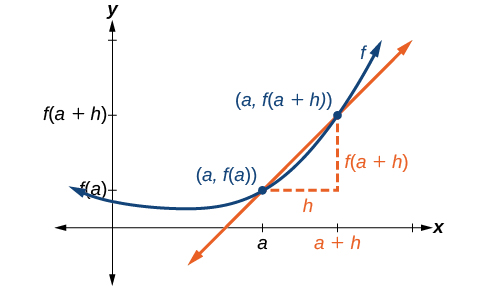
Let’s imagine a point on the curve of function at as shown in [link] . The coordinates of the point are Connect this point with a second point on the curve a little to the right of with an x -value increased by some small real number The coordinates of this second point are for some positive-value

We can calculate the slope of the line connecting the two points and called a secant line , by applying the slope formula,
We use the notation to represent the slope of the secant line connecting two points.
The slope equals the average rate of change between two points and
The average rate of change (AROC) between two points and on the curve of is the slope of the line connecting the two points and is given by

Notification Switch
Would you like to follow the 'Precalculus' conversation and receive update notifications?