<< Chapter < Page Chapter >> Page >
Part a of the diagram shows a pressure versus volume graph. The pressure is along the Y axis and the volume is along the X axis. The curve has a rectangular shape. The curve is labeled A B C D. The paths A B and D C represent isobaric processes as shown by lines pointing toward the right, and A D and B C represent isochoric processes, as shown by lines pointing vertically downward. W sub A B C is shown greater than W sub A D C. The area below the curve A B C D, filling the rectangle A B C D, and the area immediately below path D C are also shaded. Part b of the diagram shows a pressure versus volume graph. The pressure is along the Y axis and the volume is along the X axis. The curve has a rectangular shape and is labeled A B C D. The paths A B and C D represent isobaric processes; A B is a line pointing to the right, and C D is a line pointing to the left. The paths B C and D A represent isochoric processes; B C points vertically downward, and D A points vertically upward. The length of the graph along A B is marked as delta V equals five hundred centimeters cubed. The line A B on the graph is shown to have a pressure P sub A B equals one point five multiplied by ten to the power six Newtons per meter square. The line D on the graph is shown to have a pressure P sub C D equals one point two multiplied by ten to the power five Newtons per meter squared. The total work is marked as W sub tot equals W sub out plus W sub in. Part c of the diagram shows a pressure versus volume graph. The pressure is along the Y axis and the volume is along the X axis. The graph is a closed loop in the form of an ellipse with the arrow pointing in clockwise direction. The shaded area inside the ellipse represents the work done.
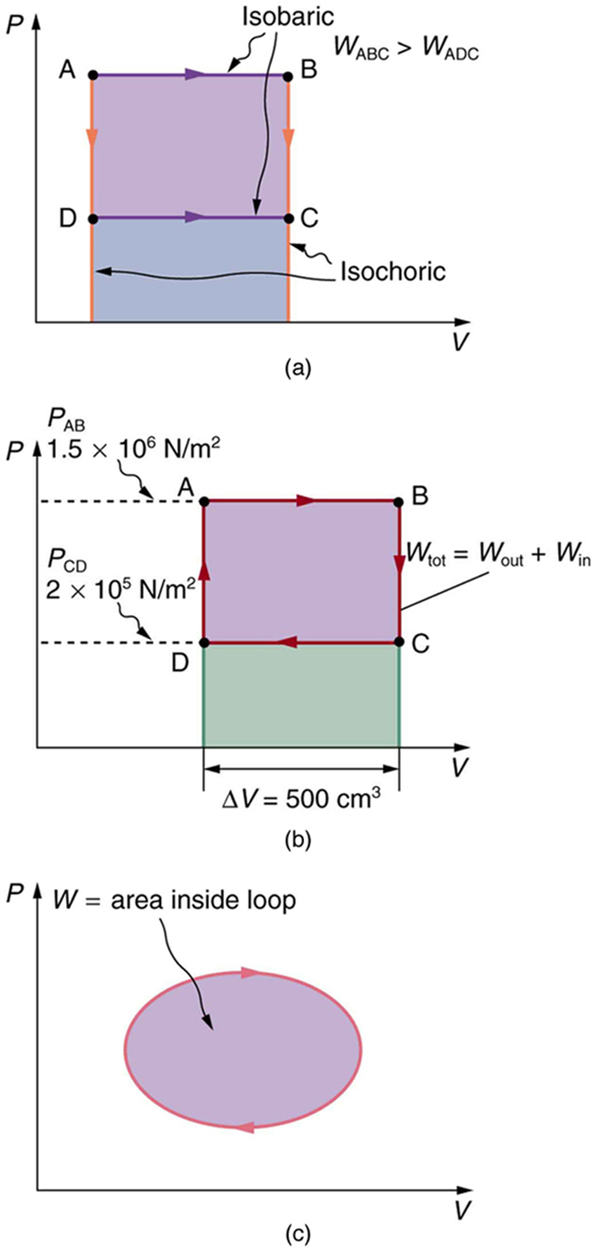
(a) The work done in going from A to C depends on path. The work is greater for the path ABC than for the path ADC, because the former is at higher pressure. In both cases, the work done is the area under the path. This area is greater for path ABC. (b) The total work done in the cyclical process ABCDA is the area inside the loop, since the negative area below CD subtracts out, leaving just the area inside the rectangle. (The values given for the pressures and the change in volume are intended for use in the example below.) (c) The area inside any closed loop is the work done in the cyclical process. If the loop is traversed in a clockwise direction, W size 12{W} {} is positive—it is work done on the outside environment. If the loop is traveled in a counter-clockwise direction, W size 12{W} {} is negative—it is work that is done to the system.

Total work done in a cyclical process equals the area inside the closed loop on a PV Diagram

Calculate the total work done in the cyclical process ABCDA shown in [link] (b) by the following two methods to verify that work equals the area inside the closed loop on the PV size 12{ ital "PV"} {} diagram. (Take the data in the figure to be precise to three significant figures.) (a) Calculate the work done along each segment of the path and add these values to get the total work. (b) Calculate the area inside the rectangle ABCDA.

Strategy

To find the work along any path on a PV size 12{ ital "PV"} {} diagram, you use the fact that work is pressure times change in volume, or W = P Δ V size 12{W=PΔV} {} . So in part (a), this value is calculated for each leg of the path around the closed loop.

Solution for (a)

The work along path AB is

W AB = P AB Δ V AB = ( 1 . 50 × 10 6 N/m 2 ) ( 5 . 00 × 10 –4 m 3 ) = 750 J. alignl { stack { size 12{W rSub { size 8{"AB"} } =P rSub { size 8{"AB"} } DV rSub { size 8{"AB"} } } {} #= \( 1 "." "50"´"10" rSup { size 8{6} } " N/m" rSup { size 8{2} } \) \( 5 "." "00"´"10" rSup { size 8{4} } " m" rSup { size 8{3} } \) ="750"" J" "." {} } } {}

Since the path BC is isochoric, Δ V BC = 0 size 12{DV rSub { size 8{"BC"} } =0} {} , and so W BC = 0 size 12{W rSub { size 8{"BC"} } =0} {} . The work along path CD is negative, since Δ V CD size 12{DV rSub { size 8{"CD"} } } {} is negative (the volume decreases). The work is

W CD = P CD Δ V CD = ( 2 . 00 × 10 5 N/m 2 ) ( –5 . 00 × 10 –4 m 3 ) = 100 J . alignl { stack { size 12{W rSub { size 8{"CD"} } =P rSub { size 8{"CD"} } DV rSub { size 8{"CD"} } } {} #= \( 2 "." "00"´"10" rSup { size 8{5} } " N/m" rSup { size 8{2} } \) \( 5 "." "00"´"10" rSup { size 8{4} } " m" rSup { size 8{3} } \) "=-""100"" J" "." {} } } {}

Again, since the path DA is isochoric, Δ V DA = 0 size 12{DV rSub { size 8{"DA"} } =0} {} , and so W DA = 0 size 12{W rSub { size 8{"DA"} } =0} {} . Now the total work is

W = W AB + W BC + W CD + W DA = 750 J + 0 + ( 100 J ) + 0 = 650 J.

Solution for (b)

The area inside the rectangle is its height times its width, or

area = ( P AB P CD ) Δ V = ( 1.50 × 10 6 N/m 2 ) ( 2 . 00 × 10 5 N/m 2 ) ( 5 . 00 × 10 4 m 3 ) = 650 J. alignl { stack { size 12{"area"= \( P rSub { size 8{"AB"} } -P rSub { size 8{"CD"} } \) DV} {} #= left [ \( 1 "." "50"´"10" rSup { size 8{6} } " N/m" rSup { size 8{2} } \) - \( 2 "." "00"´"10" rSup { size 8{5} } " N/m" rSup { size 8{2} } \) right ]´ \( 5 "." "00"´"10" rSup { size 8{-4} } " m" rSup { size 8{3} } \) {} #="750"" J" "." {} } } {}

Thus,

area = 650 J = W . size 12{"area"="650"" J"=W} {}

Discussion

The result, as anticipated, is that the area inside the closed loop equals the work done. The area is often easier to calculate than is the work done along each path. It is also convenient to visualize the area inside different curves on PV size 12{ ital "PV"} {} diagrams in order to see which processes might produce the most work. Recall that work can be done to the system, or by the system, depending on the sign of W size 12{W} {} . A positive W size 12{W} {} is work that is done by the system on the outside environment; a negative W size 12{W} {} represents work done by the environment on the system.

[link] (a) shows two other important processes on a PV size 12{ ital "PV"} {} diagram. For comparison, both are shown starting from the same point A. The upper curve ending at point B is an isothermal process—that is, one in which temperature is kept constant. If the gas behaves like an ideal gas, as is often the case, and if no phase change occurs, then PV = nRT size 12{ ital "PV"= ital "nRT"} {} . Since T size 12{T} {} is constant, PV size 12{ ital "PV"} {} is a constant for an isothermal process. We ordinarily expect the temperature of a gas to decrease as it expands, and so we correctly suspect that heat transfer must occur from the surroundings to the gas to keep the temperature constant during an isothermal expansion. To show this more rigorously for the special case of a monatomic ideal gas, we note that the average kinetic energy of an atom in such a gas is given by

Questions & Answers

Ayele, K., 2003. Introductory Economics, 3rd ed., Addis Ababa.
Widad Reply
can you send the book attached ?
Ariel
?
Ariel
What is economics
Widad Reply
the study of how humans make choices under conditions of scarcity
AI-Robot
U(x,y) = (x×y)1/2 find mu of x for y
Desalegn Reply
U(x,y) = (x×y)1/2 find mu of x for y
Desalegn
what is ecnomics
Jan Reply
this is the study of how the society manages it's scarce resources
Belonwu
what is macroeconomic
John Reply
macroeconomic is the branch of economics which studies actions, scale, activities and behaviour of the aggregate economy as a whole.
husaini
etc
husaini
difference between firm and industry
husaini Reply
what's the difference between a firm and an industry
Abdul
firm is the unit which transform inputs to output where as industry contain combination of firms with similar production 😅😅
Abdulraufu
Suppose the demand function that a firm faces shifted from Qd  120 3P to Qd  90  3P and the supply function has shifted from QS  20  2P to QS 10  2P . a) Find the effect of this change on price and quantity. b) Which of the changes in demand and supply is higher?
Toofiq Reply
explain standard reason why economic is a science
innocent Reply
factors influencing supply
Petrus Reply
what is economic.
Milan Reply
scares means__________________ends resources. unlimited
Jan
economics is a science that studies human behaviour as a relationship b/w ends and scares means which have alternative uses
Jan
calculate the profit maximizing for demand and supply
Zarshad Reply
Why qualify 28 supplies
Milan
what are explicit costs
Nomsa Reply
out-of-pocket costs for a firm, for example, payments for wages and salaries, rent, or materials
AI-Robot
concepts of supply in microeconomics
David Reply
economic overview notes
Amahle Reply
identify a demand and a supply curve
Salome Reply
i don't know
Parul
there's a difference
Aryan
Demand curve shows that how supply and others conditions affect on demand of a particular thing and what percent demand increase whith increase of supply of goods
Israr
Hi Sir please how do u calculate Cross elastic demand and income elastic demand?
Abari
Got questions? Join the online conversation and get instant answers!
Jobilize.com Reply
Practice Key Terms 6

Get Jobilize Job Search Mobile App in your pocket Now!

Get it on Google Play Download on the App Store Now


Source:  OpenStax, College physics. OpenStax CNX. Jul 27, 2015 Download for free at http://legacy.cnx.org/content/col11406/1.9
Google Play and the Google Play logo are trademarks of Google Inc.

Notification Switch

Would you like to follow the 'College physics' conversation and receive update notifications?

Ask