<< Chapter < Page Chapter >> Page >
Part a of the diagram shows a pressure versus volume graph. The pressure is along the Y axis and the volume is along the X axis. The curve has a rectangular shape. The curve is labeled A B C D. The paths A B and D C represent isobaric processes as shown by lines pointing toward the right, and A D and B C represent isochoric processes, as shown by lines pointing vertically downward. W sub A B C is shown greater than W sub A D C. The area below the curve A B C D, filling the rectangle A B C D, and the area immediately below path D C are also shaded. Part b of the diagram shows a pressure versus volume graph. The pressure is along the Y axis and the volume is along the X axis. The curve has a rectangular shape and is labeled A B C D. The paths A B and C D represent isobaric processes; A B is a line pointing to the right, and C D is a line pointing to the left. The paths B C and D A represent isochoric processes; B C points vertically downward, and D A points vertically upward. The length of the graph along A B is marked as delta V equals five hundred centimeters cubed. The line A B on the graph is shown to have a pressure P sub A B equals one point five multiplied by ten to the power six Newtons per meter square. The line D on the graph is shown to have a pressure P sub C D equals one point two multiplied by ten to the power five Newtons per meter squared. The total work is marked as W sub tot equals W sub out plus W sub in. Part c of the diagram shows a pressure versus volume graph. The pressure is along the Y axis and the volume is along the X axis. The graph is a closed loop in the form of an ellipse with the arrow pointing in clockwise direction. The shaded area inside the ellipse represents the work done.
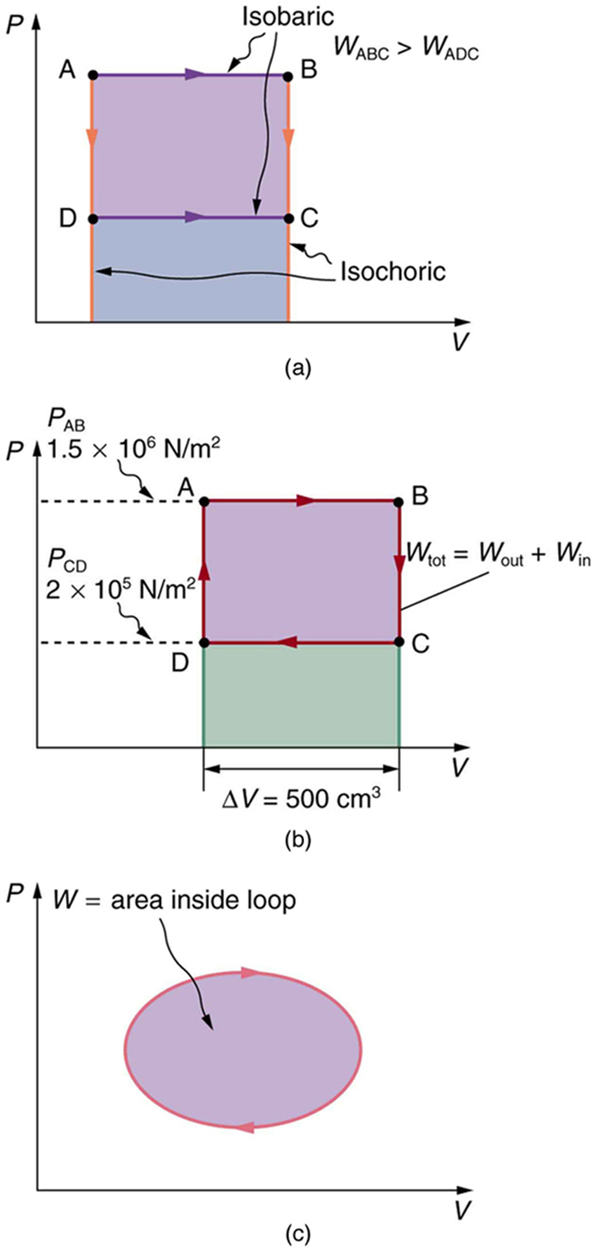
(a) The work done in going from A to C depends on path. The work is greater for the path ABC than for the path ADC, because the former is at higher pressure. In both cases, the work done is the area under the path. This area is greater for path ABC. (b) The total work done in the cyclical process ABCDA is the area inside the loop, since the negative area below CD subtracts out, leaving just the area inside the rectangle. (The values given for the pressures and the change in volume are intended for use in the example below.) (c) The area inside any closed loop is the work done in the cyclical process. If the loop is traversed in a clockwise direction, W size 12{W} {} is positive—it is work done on the outside environment. If the loop is traveled in a counter-clockwise direction, W size 12{W} {} is negative—it is work that is done to the system.

Total work done in a cyclical process equals the area inside the closed loop on a PV Diagram

Calculate the total work done in the cyclical process ABCDA shown in [link] (b) by the following two methods to verify that work equals the area inside the closed loop on the PV size 12{ ital "PV"} {} diagram. (Take the data in the figure to be precise to three significant figures.) (a) Calculate the work done along each segment of the path and add these values to get the total work. (b) Calculate the area inside the rectangle ABCDA.

Strategy

To find the work along any path on a PV size 12{ ital "PV"} {} diagram, you use the fact that work is pressure times change in volume, or W = P Δ V size 12{W=PΔV} {} . So in part (a), this value is calculated for each leg of the path around the closed loop.

Solution for (a)

The work along path AB is

W AB = P AB Δ V AB = ( 1 . 50 × 10 6 N/m 2 ) ( 5 . 00 × 10 –4 m 3 ) = 750 J. alignl { stack { size 12{W rSub { size 8{"AB"} } =P rSub { size 8{"AB"} } DV rSub { size 8{"AB"} } } {} #= \( 1 "." "50"´"10" rSup { size 8{6} } " N/m" rSup { size 8{2} } \) \( 5 "." "00"´"10" rSup { size 8{4} } " m" rSup { size 8{3} } \) ="750"" J" "." {} } } {}

Since the path BC is isochoric, Δ V BC = 0 size 12{DV rSub { size 8{"BC"} } =0} {} , and so W BC = 0 size 12{W rSub { size 8{"BC"} } =0} {} . The work along path CD is negative, since Δ V CD size 12{DV rSub { size 8{"CD"} } } {} is negative (the volume decreases). The work is

W CD = P CD Δ V CD = ( 2 . 00 × 10 5 N/m 2 ) ( –5 . 00 × 10 –4 m 3 ) = 100 J . alignl { stack { size 12{W rSub { size 8{"CD"} } =P rSub { size 8{"CD"} } DV rSub { size 8{"CD"} } } {} #= \( 2 "." "00"´"10" rSup { size 8{5} } " N/m" rSup { size 8{2} } \) \( 5 "." "00"´"10" rSup { size 8{4} } " m" rSup { size 8{3} } \) "=-""100"" J" "." {} } } {}

Again, since the path DA is isochoric, Δ V DA = 0 size 12{DV rSub { size 8{"DA"} } =0} {} , and so W DA = 0 size 12{W rSub { size 8{"DA"} } =0} {} . Now the total work is

W = W AB + W BC + W CD + W DA = 750 J + 0 + ( 100 J ) + 0 = 650 J.

Solution for (b)

The area inside the rectangle is its height times its width, or

area = ( P AB P CD ) Δ V = ( 1.50 × 10 6 N/m 2 ) ( 2 . 00 × 10 5 N/m 2 ) ( 5 . 00 × 10 4 m 3 ) = 650 J. alignl { stack { size 12{"area"= \( P rSub { size 8{"AB"} } -P rSub { size 8{"CD"} } \) DV} {} #= left [ \( 1 "." "50"´"10" rSup { size 8{6} } " N/m" rSup { size 8{2} } \) - \( 2 "." "00"´"10" rSup { size 8{5} } " N/m" rSup { size 8{2} } \) right ]´ \( 5 "." "00"´"10" rSup { size 8{-4} } " m" rSup { size 8{3} } \) {} #="750"" J" "." {} } } {}

Thus,

area = 650 J = W . size 12{"area"="650"" J"=W} {}

Discussion

The result, as anticipated, is that the area inside the closed loop equals the work done. The area is often easier to calculate than is the work done along each path. It is also convenient to visualize the area inside different curves on PV size 12{ ital "PV"} {} diagrams in order to see which processes might produce the most work. Recall that work can be done to the system, or by the system, depending on the sign of W size 12{W} {} . A positive W size 12{W} {} is work that is done by the system on the outside environment; a negative W size 12{W} {} represents work done by the environment on the system.

[link] (a) shows two other important processes on a PV size 12{ ital "PV"} {} diagram. For comparison, both are shown starting from the same point A. The upper curve ending at point B is an isothermal process—that is, one in which temperature is kept constant. If the gas behaves like an ideal gas, as is often the case, and if no phase change occurs, then PV = nRT size 12{ ital "PV"= ital "nRT"} {} . Since T size 12{T} {} is constant, PV size 12{ ital "PV"} {} is a constant for an isothermal process. We ordinarily expect the temperature of a gas to decrease as it expands, and so we correctly suspect that heat transfer must occur from the surroundings to the gas to keep the temperature constant during an isothermal expansion. To show this more rigorously for the special case of a monatomic ideal gas, we note that the average kinetic energy of an atom in such a gas is given by

Questions & Answers

it is the relatively stable flow of income
Chidubem Reply
what is circular flow of income
Divine Reply
branches of macroeconomics
SHEDRACK Reply
what is Flexible exchang rate?
poudel Reply
is gdp a reliable measurement of wealth
Atega Reply
introduction to econometrics
Husseini Reply
Hi
mostafa
hi
LEMLEM
hello
Sammol
hi
Mahesh
bi
Ruqayat
hi
Ruqayat
Hi fellas
Nyawa
hey
Sammol
hi
God
hello
Jahara
Good morning
Jorge
hi
abubakar
hi
Nmesoma
hi
Mahesh
Hi
Tom
Why is unemployment rate never zero at full employment?
Priyanka Reply
bcoz of existence of frictional unemployment in our economy.
Umashankar
what is flexible exchang rate?
poudel
due to existence of the pple with disabilities
Abdulraufu
the demand of a good rises, causing the demand for another good to fall
Rushawn Reply
is it possible to leave every good at the same level
Joseph
I don't think so. because check it, if the demand for chicken increases, people will no longer consume fish like they used to causing a fall in the demand for fish
Anuolu
is not really possible to let the value of a goods to be same at the same time.....
Salome
Suppose the inflation rate is 6%, does it mean that all the goods you purchase will cost 6% more than previous year? Provide with reasoning.
Geetha Reply
Not necessarily. To measure the inflation rate economists normally use an averaged price index of a basket of certain goods. So if you purchase goods included in the basket, you will notice that you pay 6% more, otherwise not necessarily.
Waeth
discus major problems of macroeconomics
Alii Reply
what is the problem of macroeconomics
Yoal
Economic growth Stable prices and low unemployment
Ephraim
explain inflationcause and itis degre
Miresa Reply
what is inflation
Getu
increase in general price levels
WEETO
Good day How do I calculate this question: C= 100+5yd G= 2000 T= 2000 I(planned)=200. Suppose the actual output is 3000. What is the level of planned expenditures at this level of output?
Chisomo Reply
how to calculate actual output?
Chisomo
how to calculate the equilibrium income
Beshir
Criteria for determining money supply
Thapase Reply
who we can define macroeconomics in one line
Muhammad
Aggregate demand
Mohammed
C=k100 +9y and i=k50.calculate the equilibrium level of output
Mercy Reply
Hi
Isiaka
Hi
Geli
hy
Man
👋
Bahunda
hy how are you?
Man
ys
Amisha
how are you guys
Sekou
f9 guys
Amisha
how are you guys
Sekou
ys am also fine
Amisha
fine and you guys
Geli
from Nepal
Amisha
nawalparasi district from belatari
Amisha
nd u
Amisha
I am Camara from Guinea west Africa... happy to meet you guys here
Sekou
ma management ho
Amisha
ahile becheclor ho
Amisha
hjr ktm bta ho ani k kaam grnu hunxa tw
Amisha
belatari
Amisha
1st year ho
Amisha
nd u
Amisha
ahh
Amisha
kaha biratnagar
Amisha
ys
Amisha
kina k vo
Amisha
money as unit of account means what?
Kalombe
A unit of account is something that can be used to value goods and services and make calculations
Jim
all of you please speak in English I can't understand you're language
Muhammad
I want to know how can we define macroeconomics in one line
Muhammad
it must be .9 or 0.9 no Mpc is greater than 1 Y=100+.9Y+50 Y-.9Y=150 0.1Y/0.1=150/0.1 Y=1500
Kalombe
Mercy is it clear?😋
Kalombe
hi can someone help me on this question If a negative shocks shifts the IS curve to the left, what type of policy do you suggest so as to stabilize the level of output? discuss your answer using appropriate graph.
Galge Reply
if interest rate is increased this will will reduce the level of income shifting the curve to the left ◀️
Kalombe
Got questions? Join the online conversation and get instant answers!
Jobilize.com Reply
Practice Key Terms 6

Get Jobilize Job Search Mobile App in your pocket Now!

Get it on Google Play Download on the App Store Now


Source:  OpenStax, College physics. OpenStax CNX. Jul 27, 2015 Download for free at http://legacy.cnx.org/content/col11406/1.9
Google Play and the Google Play logo are trademarks of Google Inc.

Notification Switch

Would you like to follow the 'College physics' conversation and receive update notifications?

Ask