

| << Chapter < Page | Chapter >> Page > |
Average velocity is displacement (change in position) divided by the time of travel ,
where is the average (indicated by the bar over the ) velocity, is the change in position (or displacement), and and are the final and beginning positions at times and , respectively. If the starting time is taken to be zero, then the average velocity is simply
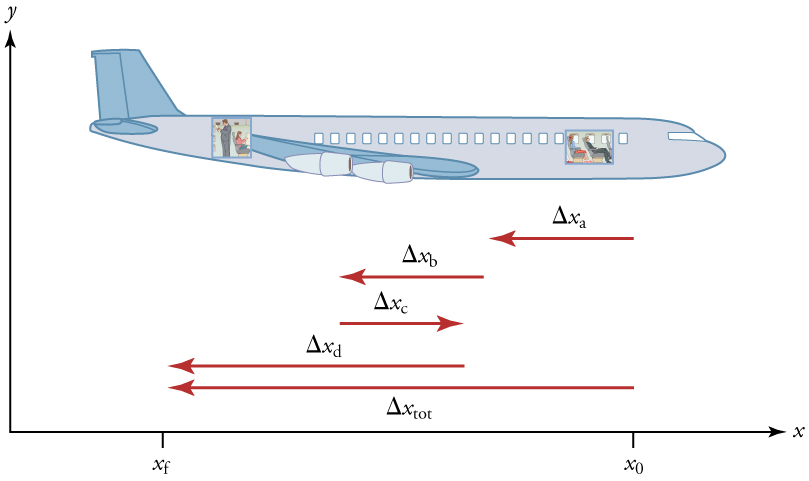
Notice that this definition indicates that velocity is a vector because displacement is a vector . It has both magnitude and direction. The SI unit for velocity is meters per second or m/s, but many other units, such as km/h, mi/h (also written as mph), and cm/s, are in common use. Suppose, for example, an airplane passenger took 5 seconds to move −4 m (the negative sign indicates that displacement is toward the back of the plane). His average velocity would be
The minus sign indicates the average velocity is also toward the rear of the plane.
The average velocity of an object does not tell us anything about what happens to it between the starting point and ending point, however. For example, we cannot tell from average velocity whether the airplane passenger stops momentarily or backs up before he goes to the back of the plane. To get more details, we must consider smaller segments of the trip over smaller time intervals.
The smaller the time intervals considered in a motion, the more detailed the information. When we carry this process to its logical conclusion, we are left with an infinitesimally small interval. Over such an interval, the average velocity becomes the instantaneous velocity or the velocity at a specific instant . A car’s speedometer, for example, shows the magnitude (but not the direction) of the instantaneous velocity of the car. (Police give tickets based on instantaneous velocity, but when calculating how long it will take to get from one place to another on a road trip, you need to use average velocity.) Instantaneous velocity is the average velocity at a specific instant in time (or over an infinitesimally small time interval).
Mathematically, finding instantaneous velocity, , at a precise instant can involve taking a limit, a calculus operation beyond the scope of this text. However, under many circumstances, we can find precise values for instantaneous velocity without calculus.
In everyday language, most people use the terms “speed” and “velocity” interchangeably. In physics, however, they do not have the same meaning and they are distinct concepts. One major difference is that speed has no direction. Thus speed is a scalar . Just as we need to distinguish between instantaneous velocity and average velocity, we also need to distinguish between instantaneous speed and average speed.
Instantaneous speed is the magnitude of instantaneous velocity. For example, suppose the airplane passenger at one instant had an instantaneous velocity of −3.0 m/s (the minus meaning toward the rear of the plane). At that same time his instantaneous speed was 3.0 m/s. Or suppose that at one time during a shopping trip your instantaneous velocity is 40 km/h due north. Your instantaneous speed at that instant would be 40 km/h—the same magnitude but without a direction. Average speed, however, is very different from average velocity. Average speed is the distance traveled divided by elapsed time.
Notification Switch
Would you like to follow the 'College physics' conversation and receive update notifications?

|
|
|
|
|

|
|

|
|

|
|

|
|

|
|

|
|

|
|

|
|

|
|
|
|