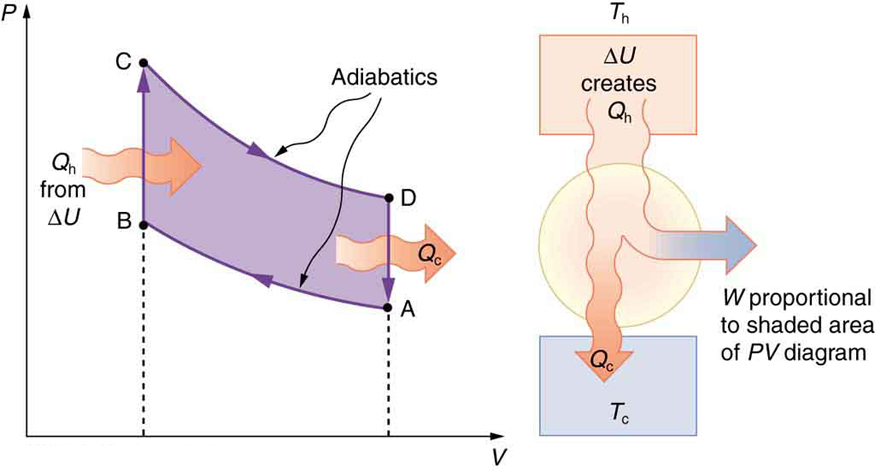
The net work done by a cyclical process is the area inside the closed path on a
diagram, such as that inside path ABCDA in
[link] . Note that in every imaginable cyclical process, it is absolutely necessary for heat transfer from the system to occur in order to get a net work output. In the Otto cycle, heat transfer occurs along path DA. If no heat transfer occurs, then the return path is the same, and the net work output is zero. The lower the temperature on the path AB, the less work has to be done to compress the gas. The area inside the closed path is then greater, and so the engine does more work and is thus more efficient. Similarly, the higher the temperature along path CD, the more work output there is. (See
[link] .) So efficiency is related to the temperatures of the hot and cold reservoirs. In the next section, we shall see what the absolute limit to the efficiency of a heat engine is, and how it is related to temperature.
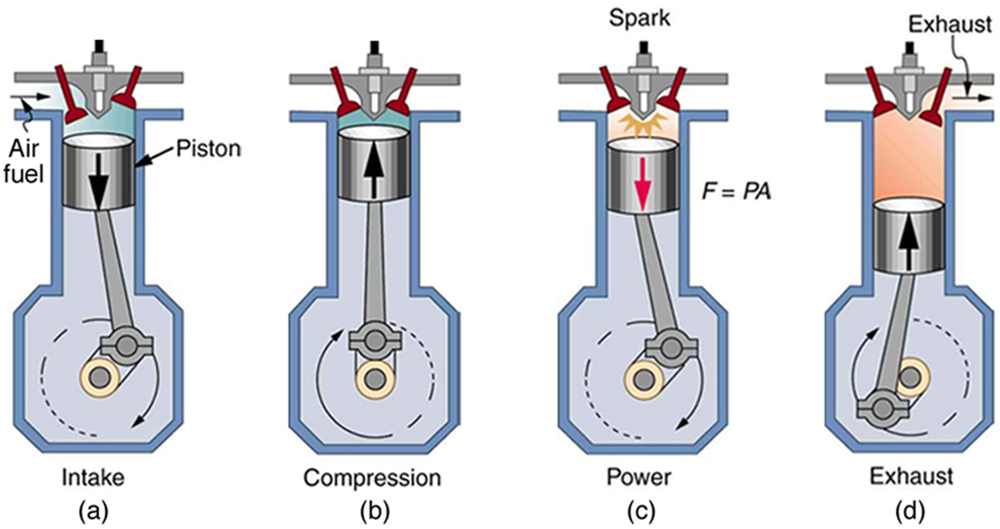
In the four-stroke internal combustion gasoline engine, heat transfer into work takes place in the cyclical process shown here. The piston is connected to a rotating crankshaft, which both takes work out of and does work on the gas in the cylinder. (a) Air is mixed with fuel during the intake stroke. (b) During the compression stroke, the air-fuel mixture is rapidly compressed in a nearly adiabatic process, as the piston rises with the valves closed. Work is done on the gas. (c) The power stroke has two distinct parts. First, the air-fuel mixture is ignited, converting chemical potential energy into thermal energy almost instantaneously, which leads to a great increase in pressure. Then the piston descends, and the gas does work by exerting a force through a distance in a nearly adiabatic process. (d) The exhaust stroke expels the hot gas to prepare the engine for another cycle, starting again with the intake stroke.
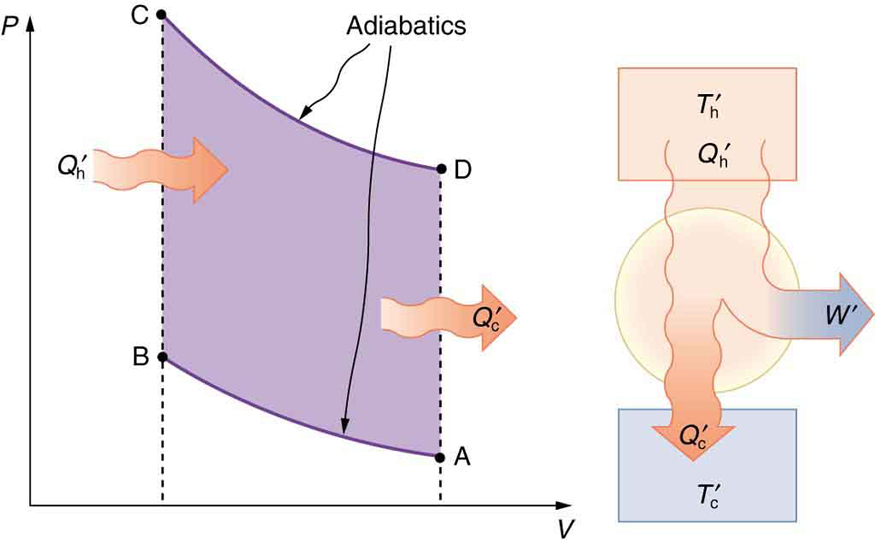
diagram for a simplified Otto cycle, analogous to that employed in an internal combustion engine. Point A corresponds to the start of the compression stroke of an internal combustion engine. Paths AB and CD are adiabatic and correspond to the compression and power strokes of an internal combustion engine, respectively. Paths BC and DA are isochoric and accomplish similar results to the ignition and exhaust-intake portions, respectively, of the internal combustion engine’s cycle. Work is done on the gas along path AB, but more work is done by the gas along path CD, so that there is a net work output.This Otto cycle produces a greater work output than the one in
[link] , because the starting temperature of path CD is higher and the starting temperature of path AB is lower. The area inside the loop is greater, corresponding to greater net work output.
Section summary
The two expressions of the second law of thermodynamics are: (i) Heat transfer occurs spontaneously from higher- to lower-temperature bodies but never spontaneously in the reverse direction; and (ii) It is impossible in any system for heat transfer from a reservoir to completely convert to work in a cyclical process in which the system returns to its initial state.
Irreversible processes depend on path and do not return to their original state. Cyclical processes are processes that return to their original state at the end of every cycle.
In a cyclical process, such as a heat engine, the net work done by the system equals the net heat transfer into the system, or
, where
is the heat transfer from the hot object (hot reservoir), and
is the heat transfer into the cold object (cold reservoir).
Efficiency can be expressed as
,
the ratio of work output divided by the amount of energy input.
The four-stroke gasoline engine is often explained in terms of the Otto cycle, which is a repeating sequence of processes that convert heat into work.
Questions & Answers
differentiate between demand and supply
giving examples
In economics, a perfect market refers to a theoretical construct where all participants have perfect information, goods are homogenous, there are no barriers to entry or exit, and prices are determined solely by supply and demand. It's an idealized model used for analysis,
When MP₁ becomes negative, TP start to decline.
Extuples Suppose that the short-run production function of certain cut-flower firm is given by: Q=4KL-0.6K2 - 0.112 •
Where is quantity of cut flower produced, I is labour input and K is fixed capital input (K-5). Determine the average product of lab
Kelo
Extuples Suppose that the short-run production function of certain cut-flower firm is given by: Q=4KL-0.6K2 - 0.112 •
Where is quantity of cut flower produced, I is labour input and K is fixed capital input (K-5). Determine the average product of labour (APL) and marginal product of labour (MPL)
Quantity demanded refers to the specific amount of a good or service that consumers are willing and able to purchase at a give price and within a specific time period. Demand, on the other hand, is a broader concept that encompasses the entire relationship between price and quantity demanded
Ezea
ok
Shukri
how do you save a country economic situation when it's falling apart
Economic growth as an increase in the production and consumption of goods and services within an economy.but
Economic development as a broader concept that encompasses not only economic growth but also social & human well being.
Shukri
production function means
Jabir
What do you think is more important to focus on when considering inequality ?
sir...I just want to ask one question... Define the term contract curve? if you are free please help me to find this answer 🙏
Asui
it is a curve that we get after connecting the pareto optimal combinations of two consumers after their mutually beneficial trade offs
Awais
thank you so much 👍 sir
Asui
In economics, the contract curve refers to the set of points in an Edgeworth box diagram where both parties involved in a trade cannot be made better off without making one of them worse off. It represents the Pareto efficient allocations of goods between two individuals or entities, where neither p
Cornelius
In economics, the contract curve refers to the set of points in an Edgeworth box diagram where both parties involved in a trade cannot be made better off without making one of them worse off. It represents the Pareto efficient allocations of goods between two individuals or entities,
Cornelius
Suppose a consumer consuming two commodities X and Y has
The following utility function u=X0.4 Y0.6. If the price of the X and Y are 2 and 3 respectively and income Constraint is birr 50.
A,Calculate quantities of x and y which maximize utility.
B,Calculate value of Lagrange multiplier.
C,Calculate quantities of X and Y consumed with a given price.
D,alculate optimum level of output .
the market for lemon has 10 potential consumers, each having an individual demand curve p=101-10Qi, where p is price in dollar's per cup and Qi is the number of cups demanded per week by the i th consumer.Find the market demand curve using algebra. Draw an individual demand curve and the market dema
suppose the production function is given by ( L, K)=L¼K¾.assuming capital is fixed find APL and MPL. consider the following short run production function:Q=6L²-0.4L³ a) find the value of L that maximizes output b)find the value of L that maximizes marginal product