<< Chapter < Page Chapter >> Page >

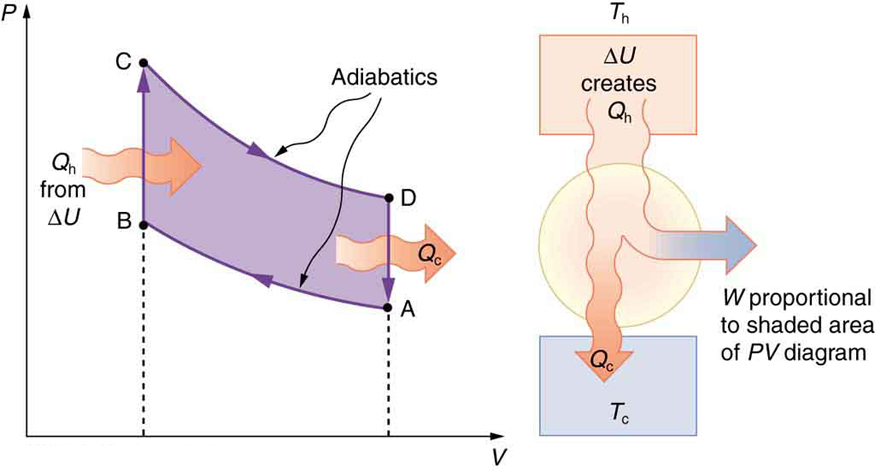
The net work done by a cyclical process is the area inside the closed path on a PV size 12{ ital "PV"} {} diagram, such as that inside path ABCDA in [link] . Note that in every imaginable cyclical process, it is absolutely necessary for heat transfer from the system to occur in order to get a net work output. In the Otto cycle, heat transfer occurs along path DA. If no heat transfer occurs, then the return path is the same, and the net work output is zero. The lower the temperature on the path AB, the less work has to be done to compress the gas. The area inside the closed path is then greater, and so the engine does more work and is thus more efficient. Similarly, the higher the temperature along path CD, the more work output there is. (See [link] .) So efficiency is related to the temperatures of the hot and cold reservoirs. In the next section, we shall see what the absolute limit to the efficiency of a heat engine is, and how it is related to temperature.

The figure shows four diagrams a, b, c, and d representing four stages of a four stroke gasoline engine. The construction of the engine has the base chamber whose cross section is in the shape of a square with flat corners, the top portion of the chamber is extended into a cylindrical section. The cylindrical section ends in the upper section with two valves, an inlet and an outlet. The cylindrical section has a movable cylinder with a piston attached to it. The piston is connected to the crank shaft in the base gas chamber. There is a spark plug on the top most part of the cylinder between the two valves. The four parts of the diagram show various stages of this four stoke engine. Part a of the diagram shows the air fuel mixture enters through the inlet valve in the upper section of the engine. The outlet valve is shown to be closed. The air and fuel is shown to exert a pressure on the piston acting downward. This force is shown to move the rotating crank shaft in clockwise direction in the gas chamber. This is the intake stroke. Part b of the diagram shows the compression stroke. Both the inlet and outlet valves are closed. The air and fuel mixture is shown to be compressed. The piston is shown to rise up as shown by a vertically pointing arrow. The piston is at the edge of the cylinder near the valves. The crankshaft in the gas chamber has shown to complete one complete cycle of rotation in the gas chamber. Part c of the diagram shows the power stroke. It has two parts, first the ignition stroke. This shows ignition of the fuel in the cylinder and pressure buildup in the region. Then in the second part the piston is shown to descend down the cylinder moving the crankshaft in the gas chamber in the clockwise direction. Part d of the figure shows the exhaust stroke. The piston expels the hot gas by moving upward and the gas is expelled through the exhaust valve.
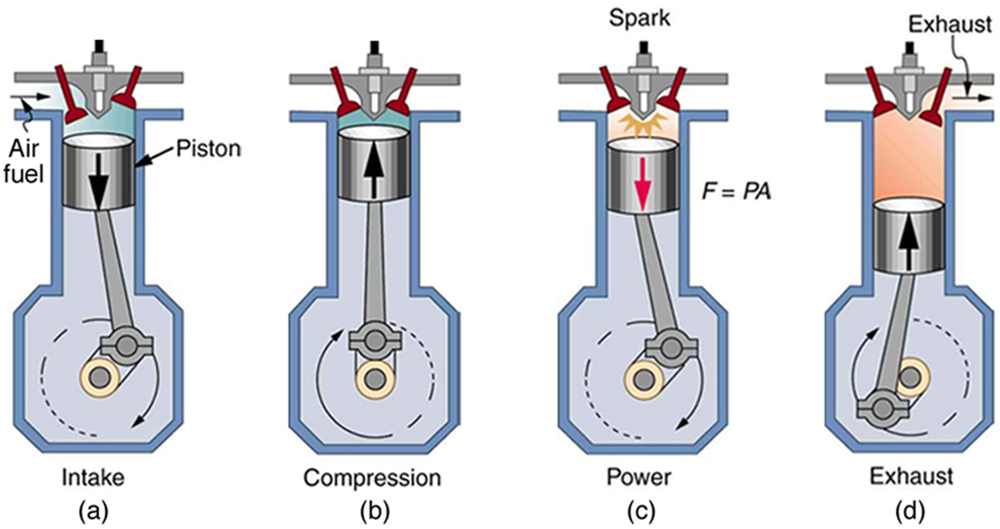
In the four-stroke internal combustion gasoline engine, heat transfer into work takes place in the cyclical process shown here. The piston is connected to a rotating crankshaft, which both takes work out of and does work on the gas in the cylinder. (a) Air is mixed with fuel during the intake stroke. (b) During the compression stroke, the air-fuel mixture is rapidly compressed in a nearly adiabatic process, as the piston rises with the valves closed. Work is done on the gas. (c) The power stroke has two distinct parts. First, the air-fuel mixture is ignited, converting chemical potential energy into thermal energy almost instantaneously, which leads to a great increase in pressure. Then the piston descends, and the gas does work by exerting a force through a distance in a nearly adiabatic process. (d) The exhaust stroke expels the hot gas to prepare the engine for another cycle, starting again with the intake stroke.
Part a of the figure shows a graph of pressure P versus volume V for an Otto cycle. The pressure P is along the Y axis and the volume V is along the X axis. The graph shows a complete cycle A B C D.  The path begins at point A; the curve rises upward from point A to point B along the direction of the negative X axis. This is marked as an adiabatic process. Then the curve rises vertically up from point B to point C in a direction perpendicular to the X axis. Then the curve moves smoothly down to point D along the direction of the positive X axis. This is also marked as an adiabatic process. The last part of the curve drops vertically down from point D back to point A. The path A B is slightly lower than path C D. Heat Q sub h is shown to enter the system as shown by a bold arrow to the curve B C. Heat Q sub c is shown to leave the system as shown by a bold arrow near D A. The area inside A B C D is shaded, and the area of the shaded region is shown proportional to the work W. Part b of the diagram shows an internal combustion engine represented as a circle. The hot reservoir is a rectangular section at the top of the circle shown at temperature T sub h. A cold reservoir is shown as a rectangular section in the bottom part of the circle at temperature T sub c. Heat Q sub h is shown to enter the heat engine, as shown by a bold arrow. Work W is produced as output, shown to leave the system, and the remaining heat Q sub c is returned back to the cold reservoir as shown by bold arrow toward it.
PV size 12{ ital "PV"} {} 
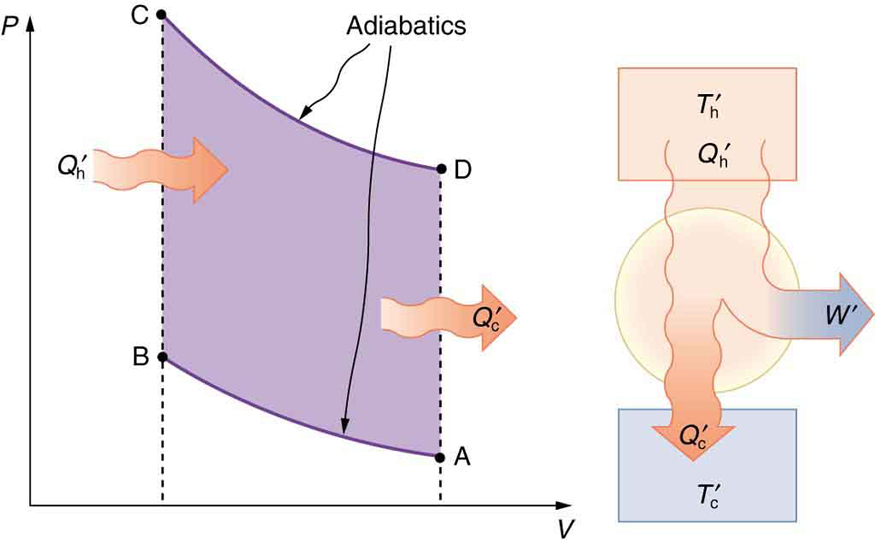
diagram for a simplified Otto cycle, analogous to that employed in an internal combustion engine. Point A corresponds to the start of the compression stroke of an internal combustion engine. Paths AB and CD are adiabatic and correspond to the compression and power strokes of an internal combustion engine, respectively. Paths BC and DA are isochoric and accomplish similar results to the ignition and exhaust-intake portions, respectively, of the internal combustion engine’s cycle. Work is done on the gas along path AB, but more work is done by the gas along path CD, so that there is a net work output.
Part a of the figure shows a graph of pressure P versus volume V for an Otto cycle. The pressure P is along the Y axis and the volume V is along the X axis. The graph shows a complete cycle A B C D. The path begins at point A; the curve rises upward from point A to point B along the direction of the negative X axis. This is marked as an adiabatic process. Then the curve rises vertically up from point B to point C in a direction perpendicular to the X axis. Then the curve moves smoothly down to point D along the direction of the positive X axis. This is also marked as an adiabatic process. The last part of the curve drops vertically down from point D back to point A. The path A B is much lower than path C D, which shows that the starting temperature of path C D is higher than A B. Heat Q sub h prime enters the system as shown by a bold arrow to the curve B C. Heat Q sub c prime leaves the system, as shown by a bold arrow near D A. The area inside A B C D is shaded. Part b of the diagram shows an internal combustion engine represented as a circle. The hot reservoir is a rectangular section at the top of the circle shown at temperature T sub h prime. A cold reservoir is shown as a rectangular section in the bottom part of the circle at temperature T sub c prime. Heat Q sub h prime enters the heat engine as shown by a bold arrow, a work W prime is produced as output, shown to leave the system, and the remaining heat Q sub c prime is returned back to the cold reservoir, as shown by a bold arrow toward it.
This Otto cycle produces a greater work output than the one in [link] , because the starting temperature of path CD is higher and the starting temperature of path AB is lower. The area inside the loop is greater, corresponding to greater net work output.

Section summary

  • The two expressions of the second law of thermodynamics are: (i) Heat transfer occurs spontaneously from higher- to lower-temperature bodies but never spontaneously in the reverse direction; and (ii) It is impossible in any system for heat transfer from a reservoir to completely convert to work in a cyclical process in which the system returns to its initial state.
  • Irreversible processes depend on path and do not return to their original state. Cyclical processes are processes that return to their original state at the end of every cycle.
  • In a cyclical process, such as a heat engine, the net work done by the system equals the net heat transfer into the system, or W = Q h Q c , where Q h is the heat transfer from the hot object (hot reservoir), and Q c is the heat transfer into the cold object (cold reservoir).
  • Efficiency can be expressed as Eff = W Q h size 12{ ital "Eff"= { {W} over {Q rSub { size 8{h} } } } } {} , the ratio of work output divided by the amount of energy input.
  • The four-stroke gasoline engine is often explained in terms of the Otto cycle, which is a repeating sequence of processes that convert heat into work.

Questions & Answers

it is the relatively stable flow of income
Chidubem Reply
what is circular flow of income
Divine Reply
branches of macroeconomics
SHEDRACK Reply
what is Flexible exchang rate?
poudel Reply
is gdp a reliable measurement of wealth
Atega Reply
introduction to econometrics
Husseini Reply
Hi
mostafa
hi
LEMLEM
hello
Sammol
hi
Mahesh
bi
Ruqayat
hi
Ruqayat
Hi fellas
Nyawa
hey
Sammol
hi
God
hello
Jahara
Good morning
Jorge
hi
abubakar
hi
Nmesoma
hi
Mahesh
Hi
Tom
Why is unemployment rate never zero at full employment?
Priyanka Reply
bcoz of existence of frictional unemployment in our economy.
Umashankar
what is flexible exchang rate?
poudel
due to existence of the pple with disabilities
Abdulraufu
the demand of a good rises, causing the demand for another good to fall
Rushawn Reply
is it possible to leave every good at the same level
Joseph
I don't think so. because check it, if the demand for chicken increases, people will no longer consume fish like they used to causing a fall in the demand for fish
Anuolu
is not really possible to let the value of a goods to be same at the same time.....
Salome
Suppose the inflation rate is 6%, does it mean that all the goods you purchase will cost 6% more than previous year? Provide with reasoning.
Geetha Reply
Not necessarily. To measure the inflation rate economists normally use an averaged price index of a basket of certain goods. So if you purchase goods included in the basket, you will notice that you pay 6% more, otherwise not necessarily.
Waeth
discus major problems of macroeconomics
Alii Reply
what is the problem of macroeconomics
Yoal
Economic growth Stable prices and low unemployment
Ephraim
explain inflationcause and itis degre
Miresa Reply
what is inflation
Getu
increase in general price levels
WEETO
Good day How do I calculate this question: C= 100+5yd G= 2000 T= 2000 I(planned)=200. Suppose the actual output is 3000. What is the level of planned expenditures at this level of output?
Chisomo Reply
how to calculate actual output?
Chisomo
how to calculate the equilibrium income
Beshir
Criteria for determining money supply
Thapase Reply
who we can define macroeconomics in one line
Muhammad
Aggregate demand
Mohammed
C=k100 +9y and i=k50.calculate the equilibrium level of output
Mercy Reply
Hi
Isiaka
Hi
Geli
hy
Man
👋
Bahunda
hy how are you?
Man
ys
Amisha
how are you guys
Sekou
f9 guys
Amisha
how are you guys
Sekou
ys am also fine
Amisha
fine and you guys
Geli
from Nepal
Amisha
nawalparasi district from belatari
Amisha
nd u
Amisha
I am Camara from Guinea west Africa... happy to meet you guys here
Sekou
ma management ho
Amisha
ahile becheclor ho
Amisha
hjr ktm bta ho ani k kaam grnu hunxa tw
Amisha
belatari
Amisha
1st year ho
Amisha
nd u
Amisha
ahh
Amisha
kaha biratnagar
Amisha
ys
Amisha
kina k vo
Amisha
money as unit of account means what?
Kalombe
A unit of account is something that can be used to value goods and services and make calculations
Jim
all of you please speak in English I can't understand you're language
Muhammad
I want to know how can we define macroeconomics in one line
Muhammad
it must be .9 or 0.9 no Mpc is greater than 1 Y=100+.9Y+50 Y-.9Y=150 0.1Y/0.1=150/0.1 Y=1500
Kalombe
Mercy is it clear?😋
Kalombe
hi can someone help me on this question If a negative shocks shifts the IS curve to the left, what type of policy do you suggest so as to stabilize the level of output? discuss your answer using appropriate graph.
Galge Reply
if interest rate is increased this will will reduce the level of income shifting the curve to the left ◀️
Kalombe
Got questions? Join the online conversation and get instant answers!
Jobilize.com Reply
Practice Key Terms 4

Get Jobilize Job Search Mobile App in your pocket Now!

Get it on Google Play Download on the App Store Now


Source:  OpenStax, College physics. OpenStax CNX. Jul 27, 2015 Download for free at http://legacy.cnx.org/content/col11406/1.9
Google Play and the Google Play logo are trademarks of Google Inc.

Notification Switch

Would you like to follow the 'College physics' conversation and receive update notifications?

Ask