| << Chapter < Page | Chapter >> Page > |
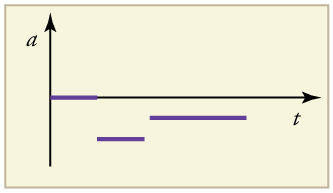
A graph of velocity vs. time of a ship coming into a harbor is shown below. (a) Describe the motion of the ship based on the graph. (b)What would a graph of the ship’s acceleration look like?
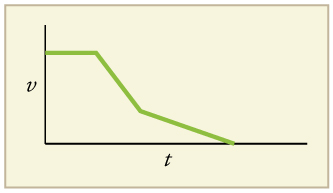
(a) The ship moves at constant velocity and then begins to decelerate at a constant rate. At some point, its deceleration rate decreases. It maintains this lower deceleration rate until it stops moving.
(b) A graph of acceleration vs. time would show zero acceleration in the first leg, large and constant negative acceleration in the second leg, and constant negative acceleration.
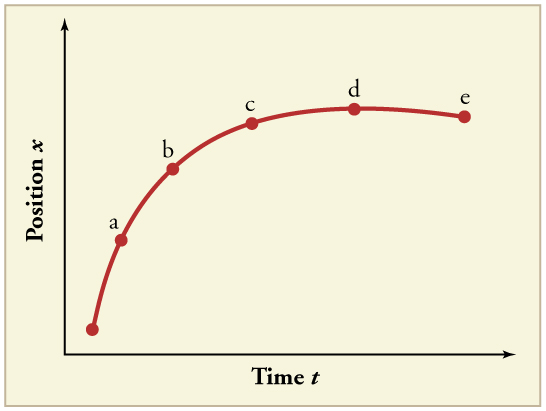
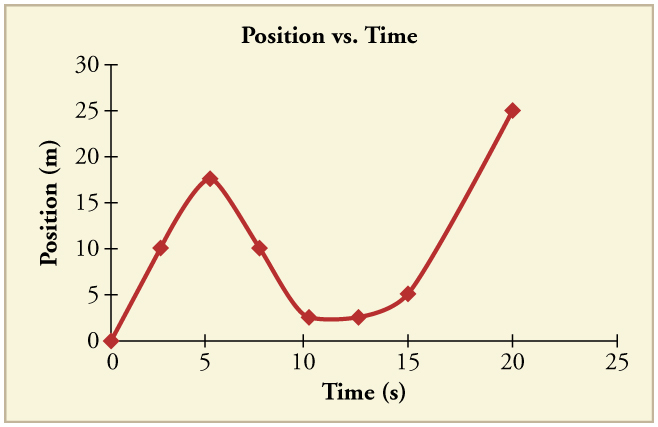
(a) Explain how you can use the graph of position versus time in [link] to describe the change in velocity over time. Identify (b) the time ( , , , , or ) at which the instantaneous velocity is greatest, (c) the time at which it is zero, and (d) the time at which it is negative.
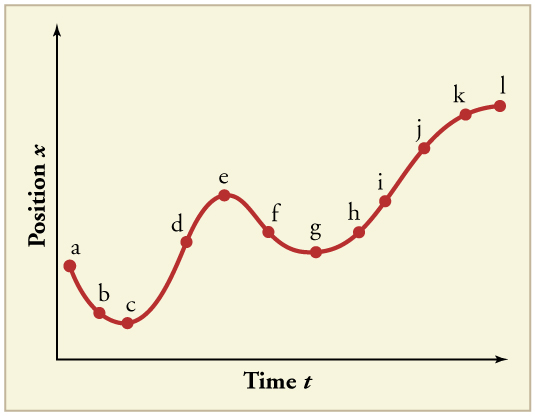
(a) Sketch a graph of velocity versus time corresponding to the graph of displacement versus time given in [link] . (b) Identify the time or times ( , , , etc.) at which the instantaneous velocity is greatest. (c) At which times is it zero? (d) At which times is it negative?
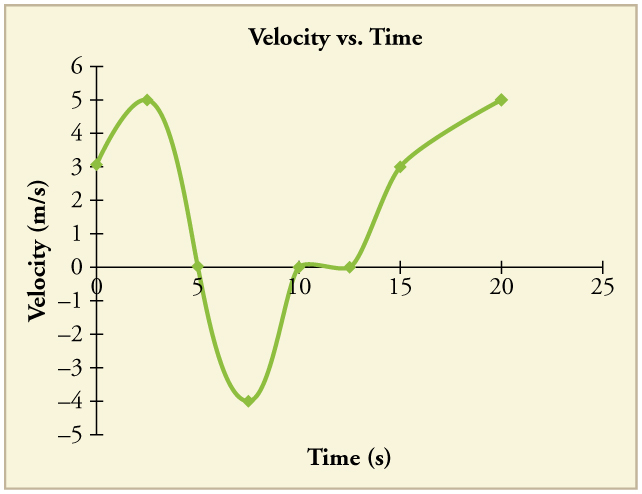
(a) Explain how you can determine the acceleration over time from a velocity versus time graph such as the one in [link] . (b) Based on the graph, how does acceleration change over time?
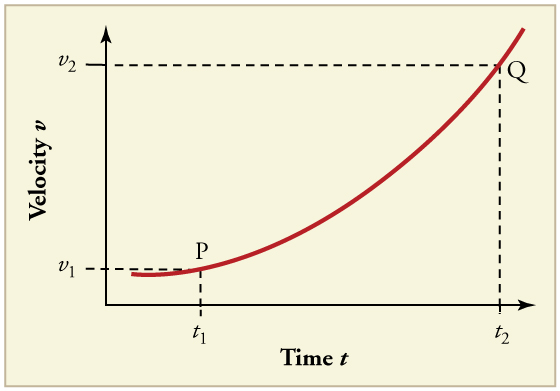
(a) Sketch a graph of acceleration versus time corresponding to the graph of velocity versus time given in [link] . (b) Identify the time or times ( , , , etc.) at which the acceleration is greatest. (c) At which times is it zero? (d) At which times is it negative?
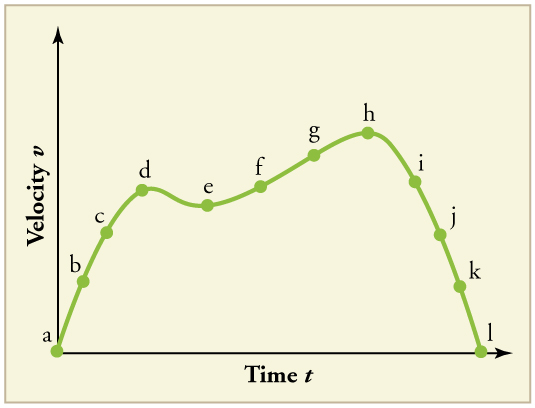
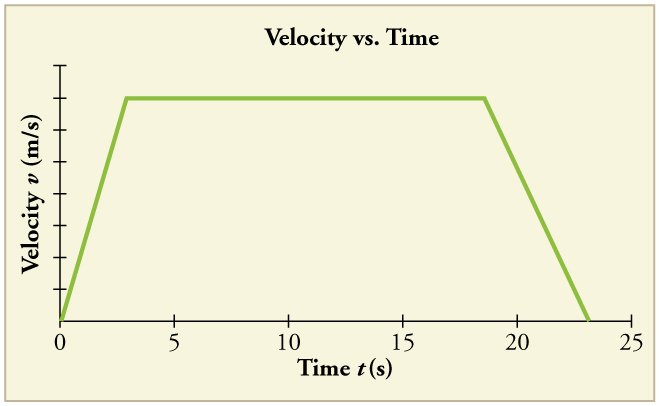
Consider the velocity vs. time graph of a person in an elevator shown in [link] . Suppose the elevator is initially at rest. It then accelerates for 3 seconds, maintains that velocity for 15 seconds, then decelerates for 5 seconds until it stops. The acceleration for the entire trip is not constant so we cannot use the equations of motion from Motion Equations for Constant Acceleration in One Dimension for the complete trip. (We could, however, use them in the three individual sections where acceleration is a constant.) Sketch graphs of (a) position vs. time and (b) acceleration vs. time for this trip.
A cylinder is given a push and then rolls up an inclined plane. If the origin is the starting point, sketch the position, velocity, and acceleration of the cylinder vs. time as it goes up and then down the plane.
Note: There is always uncertainty in numbers taken from graphs. If your answers differ from expected values, examine them to see if they are within data extraction uncertainties estimated by you.
(a) By taking the slope of the curve in [link] , verify that the velocity of the jet car is 115 m/s at . (b) By taking the slope of the curve at any point in [link] , verify that the jet car’s acceleration is .
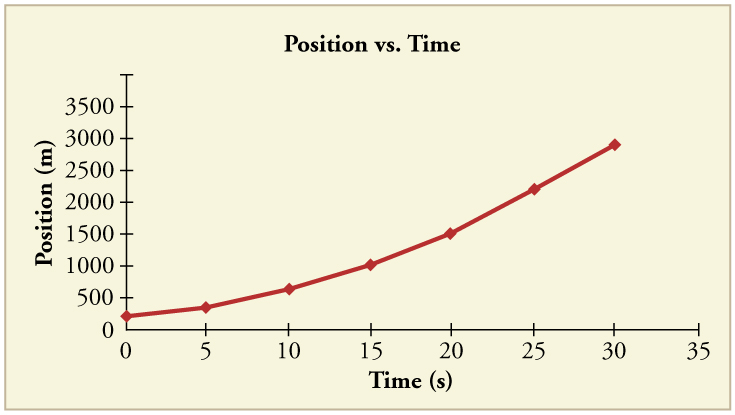
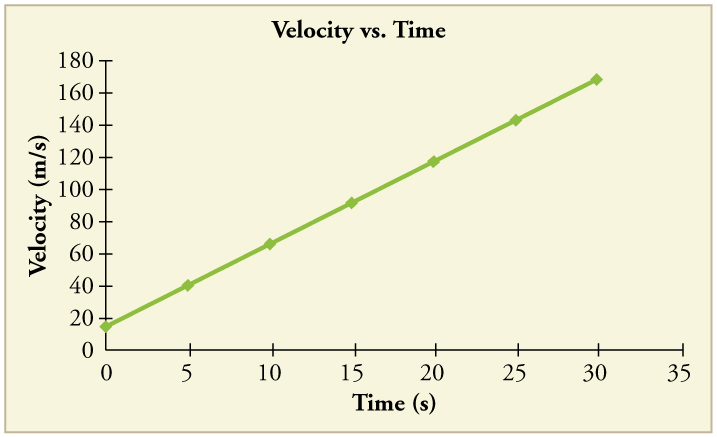
(a)
(b)
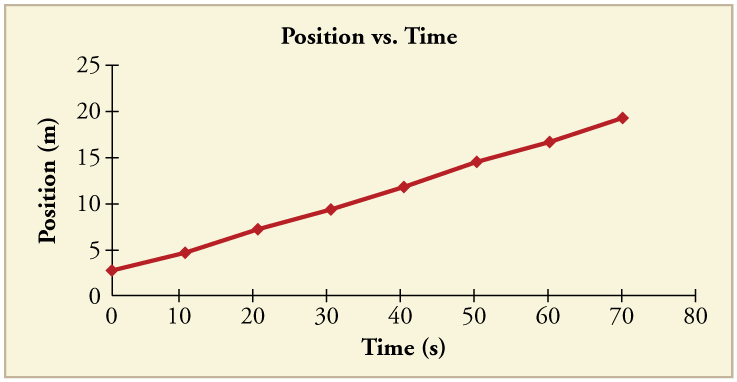
Using approximate values, calculate the slope of the curve in [link] to verify that the velocity at is 0.208 m/s. Assume all values are known to 3 significant figures.
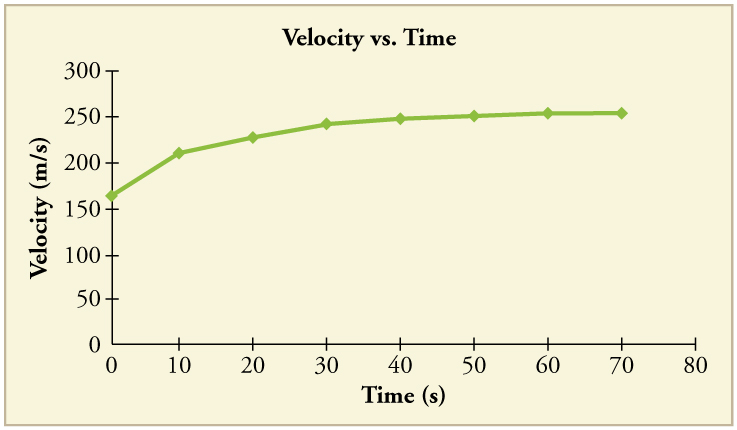
Using approximate values, calculate the slope of the curve in [link] to verify that the velocity at is 0.238 m/s. Assume all values are known to 3 significant figures.
By taking the slope of the curve in [link] , verify that the acceleration is at .
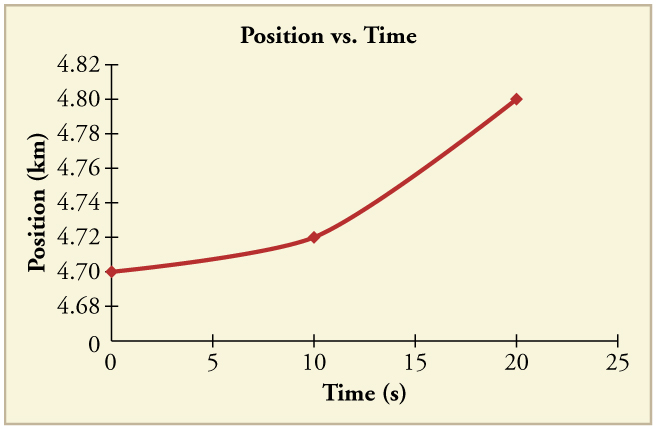
Construct the displacement graph for the subway shuttle train as shown in [link] (a). Your graph should show the position of the train, in kilometers, from t = 0 to 20 s. You will need to use the information on acceleration and velocity given in the examples for this figure.
(a) Take the slope of the curve in [link] to find the jogger’s velocity at . (b) Repeat at 7.5 s. These values must be consistent with the graph in [link] .

A graph of is shown for a world-class track sprinter in a 100-m race. (See [link] ). (a) What is his average velocity for the first 4 s? (b) What is his instantaneous velocity at ? (c) What is his average acceleration between 0 and 4 s? (d) What is his time for the race?
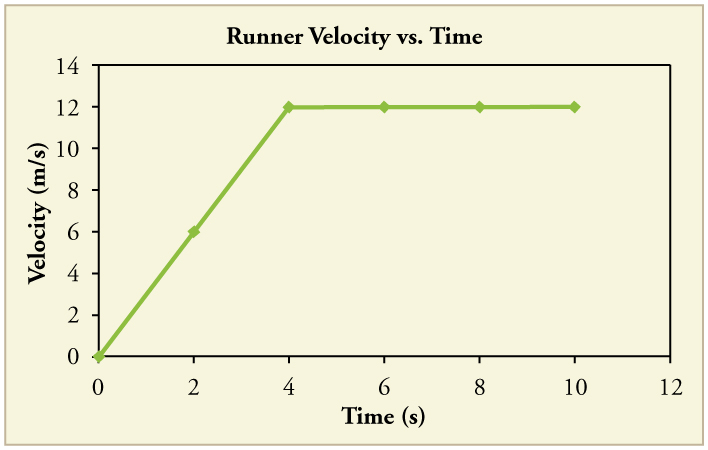
(a) 6 m/s
(b) 12 m/s
(c)
(d) 10 s
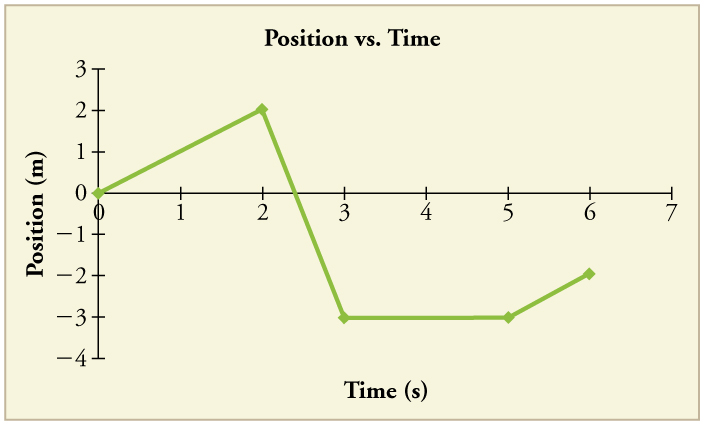
[link] shows the displacement graph for a particle for 5 s. Draw the corresponding velocity and acceleration graphs.

Notification Switch
Would you like to follow the 'College physics' conversation and receive update notifications?