<< Chapter < Page Chapter >> Page >

Carnot’s interesting result implies that 100% efficiency would be possible only if T c = 0 K size 12{T rSub { size 8{c} } =0" K"} {} —that is, only if the cold reservoir were at absolute zero, a practical and theoretical impossibility. But the physical implication is this—the only way to have all heat transfer go into doing work is to remove all thermal energy, and this requires a cold reservoir at absolute zero.

It is also apparent that the greatest efficiencies are obtained when the ratio T c / T h size 12{T rSub { size 8{c} } /T rSub { size 8{h} } } {} is as small as possible. Just as discussed for the Otto cycle in the previous section, this means that efficiency is greatest for the highest possible temperature of the hot reservoir and lowest possible temperature of the cold reservoir. (This setup increases the area inside the closed loop on the PV size 12{ ital "PV"} {} diagram; also, it seems reasonable that the greater the temperature difference, the easier it is to divert the heat transfer to work.) The actual reservoir temperatures of a heat engine are usually related to the type of heat source and the temperature of the environment into which heat transfer occurs. Consider the following example.

Part a of the figure shows a graph of pressure P versus volume V for a Carnot cycle. The pressure P is along the Y axis and the volume V is along the X axis. The graph shows a complete cycle A B C D. The path begins at point A, then it moves smoothly down till point B along the direction of the X axis. This is marked as an isotherm at temperature T sub h. Then the curve drops down further, along a different curve, from point B to point C. This is marked as adiabatic expansion. The curve rises from point C to point D along the direction opposite to that of A B. This is also an isotherm but at temperature T sub c. The last part of the curve rises up from point D back to A along a direction opposite to that of B C. This is marked as adiabatic compression. The path C D is lower than path A B. Heat Q sub h enters the system, as shown by a bold arrow to the curve A B. Heat Q sub c leaves the system as shown by a bold arrow near C D. Part b of the diagram shows an internal combustion engine represented as a circle. The hot reservoir is a rectangular section at the top of the circle shown at temperature T sub h. A cold reservoir is shown as a rectangular section in the bottom part of the circle at temperature T sub c. Heat Q sub h enters the heat engine as shown by a bold arrow; work W is produced as output, shown to leave the system, and the remaining heat Q sub c is returned back to the cold reservoir, as shown by a bold arrow toward it.
PV size 12{ ital "PV"} {} 
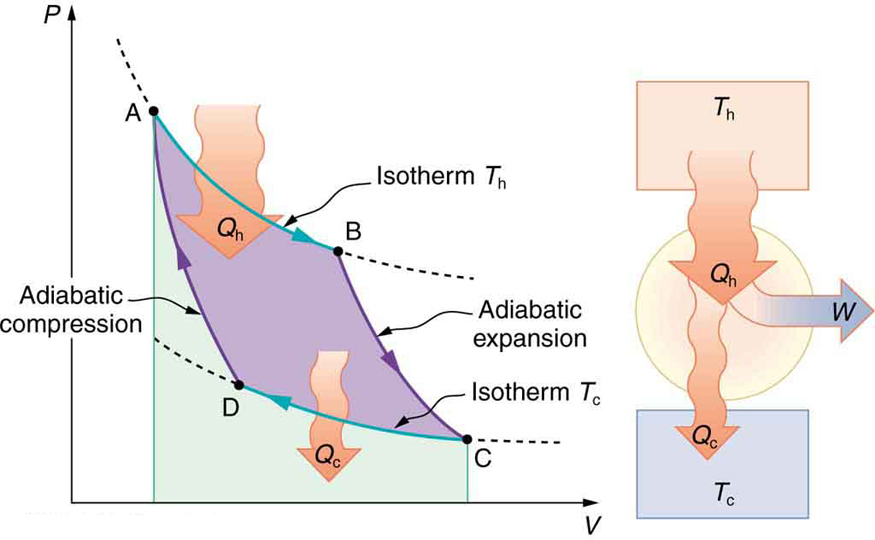
diagram for a Carnot cycle, employing only reversible isothermal and adiabatic processes. Heat transfer Q h size 12{Q rSub { size 8{h} } } {} occurs into the working substance during the isothermal path AB, which takes place at constant temperature T h size 12{T rSub { size 8{h} } } {} . Heat transfer Q c size 12{Q rSub { size 8{c} } } {} occurs out of the working substance during the isothermal path CD, which takes place at constant temperature T c size 12{T rSub { size 8{c} } } {} . The net work output W size 12{W} {} equals the area inside the path ABCDA. Also shown is a schematic of a Carnot engine operating between hot and cold reservoirs at temperatures T h size 12{T rSub { size 8{h} } } {} and T c size 12{T rSub { size 8{c} } } {} . Any heat engine using reversible processes and operating between these two temperatures will have the same maximum efficiency as the Carnot engine.

Maximum theoretical efficiency for a nuclear reactor

A nuclear power reactor has pressurized water at 300 º C size 12{"300"°C} {} 
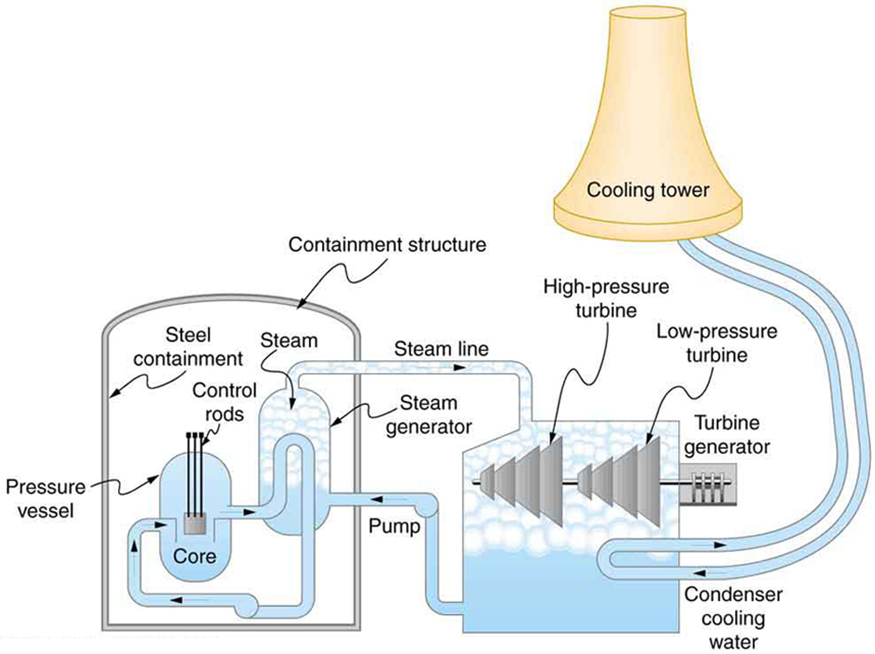
. (Higher temperatures are theoretically possible but practically not, due to limitations with materials used in the reactor.) Heat transfer from this water is a complex process (see [link] ). Steam, produced in the steam generator, is used to drive the turbine-generators. Eventually the steam is condensed to water at 27 º C size 12{"27"°C} {} and then heated again to start the cycle over. Calculate the maximum theoretical efficiency for a heat engine operating between these two temperatures.

Diagram shows a schematic diagram of a pressurized water nuclear reactor and the steam turbines that convert work into electrical energy. There is a pressure vessel in the middle, dome shaped at the ends. This has a nuclear core in it. The core is a small square in the center of the reactor. Control rods are shown as sticks of equal length attached to the core. The pressure vessel has some coolant tubes passing through it and then back to a steam chamber. These coolant tubes contain a coolant liquid that transports the heat from the pressure vessel to the steam chamber. This whole system is enclosed in another dome shaped containment structure of steel. The water supply to steam chamber and the steam outlet are seen to come out of this chamber. This steam is now shown to run two steam turbines, one a high pressure one and another low pressure one. The turbines are nearly triangular and segmented in shape. The steam turbine in turn generates power using a turbine generator, which is attached to the turbine system. The turbines are again housed in another chamber which gets the steam from the steam chamber and return the steam as water back to the steam chamber with pipes. A coolant tower is shown near the turbine system, which is shown to supply cool water in tubes to the turbine system to cool the steam back to water.
Schematic diagram of a pressurized water nuclear reactor and the steam turbines that convert work into electrical energy. Heat exchange is used to generate steam, in part to avoid contamination of the generators with radioactivity. Two turbines are used because this is less expensive than operating a single generator that produces the same amount of electrical energy. The steam is condensed to liquid before being returned to the heat exchanger, to keep exit steam pressure low and aid the flow of steam through the turbines (equivalent to using a lower-temperature cold reservoir). The considerable energy associated with condensation must be dissipated into the local environment; in this example, a cooling tower is used so there is no direct heat transfer to an aquatic environment. (Note that the water going to the cooling tower does not come into contact with the steam flowing over the turbines.)

Questions & Answers

it is the relatively stable flow of income
Chidubem Reply
what is circular flow of income
Divine Reply
branches of macroeconomics
SHEDRACK Reply
what is Flexible exchang rate?
poudel Reply
is gdp a reliable measurement of wealth
Atega Reply
introduction to econometrics
Husseini Reply
Hi
mostafa
hi
LEMLEM
hello
Sammol
hi
Mahesh
bi
Ruqayat
hi
Ruqayat
Hi fellas
Nyawa
hey
Sammol
hi
God
hello
Jahara
Good morning
Jorge
hi
abubakar
hi
Nmesoma
hi
Mahesh
Hi
Tom
Why is unemployment rate never zero at full employment?
Priyanka Reply
bcoz of existence of frictional unemployment in our economy.
Umashankar
what is flexible exchang rate?
poudel
due to existence of the pple with disabilities
Abdulraufu
the demand of a good rises, causing the demand for another good to fall
Rushawn Reply
is it possible to leave every good at the same level
Joseph
I don't think so. because check it, if the demand for chicken increases, people will no longer consume fish like they used to causing a fall in the demand for fish
Anuolu
is not really possible to let the value of a goods to be same at the same time.....
Salome
Suppose the inflation rate is 6%, does it mean that all the goods you purchase will cost 6% more than previous year? Provide with reasoning.
Geetha Reply
Not necessarily. To measure the inflation rate economists normally use an averaged price index of a basket of certain goods. So if you purchase goods included in the basket, you will notice that you pay 6% more, otherwise not necessarily.
Waeth
discus major problems of macroeconomics
Alii Reply
what is the problem of macroeconomics
Yoal
Economic growth Stable prices and low unemployment
Ephraim
explain inflationcause and itis degre
Miresa Reply
what is inflation
Getu
increase in general price levels
WEETO
Good day How do I calculate this question: C= 100+5yd G= 2000 T= 2000 I(planned)=200. Suppose the actual output is 3000. What is the level of planned expenditures at this level of output?
Chisomo Reply
how to calculate actual output?
Chisomo
how to calculate the equilibrium income
Beshir
Criteria for determining money supply
Thapase Reply
who we can define macroeconomics in one line
Muhammad
Aggregate demand
Mohammed
C=k100 +9y and i=k50.calculate the equilibrium level of output
Mercy Reply
Hi
Isiaka
Hi
Geli
hy
Man
👋
Bahunda
hy how are you?
Man
ys
Amisha
how are you guys
Sekou
f9 guys
Amisha
how are you guys
Sekou
ys am also fine
Amisha
fine and you guys
Geli
from Nepal
Amisha
nawalparasi district from belatari
Amisha
nd u
Amisha
I am Camara from Guinea west Africa... happy to meet you guys here
Sekou
ma management ho
Amisha
ahile becheclor ho
Amisha
hjr ktm bta ho ani k kaam grnu hunxa tw
Amisha
belatari
Amisha
1st year ho
Amisha
nd u
Amisha
ahh
Amisha
kaha biratnagar
Amisha
ys
Amisha
kina k vo
Amisha
money as unit of account means what?
Kalombe
A unit of account is something that can be used to value goods and services and make calculations
Jim
all of you please speak in English I can't understand you're language
Muhammad
I want to know how can we define macroeconomics in one line
Muhammad
it must be .9 or 0.9 no Mpc is greater than 1 Y=100+.9Y+50 Y-.9Y=150 0.1Y/0.1=150/0.1 Y=1500
Kalombe
Mercy is it clear?😋
Kalombe
hi can someone help me on this question If a negative shocks shifts the IS curve to the left, what type of policy do you suggest so as to stabilize the level of output? discuss your answer using appropriate graph.
Galge Reply
if interest rate is increased this will will reduce the level of income shifting the curve to the left ◀️
Kalombe
Got questions? Join the online conversation and get instant answers!
Jobilize.com Reply
Practice Key Terms 3

Get Jobilize Job Search Mobile App in your pocket Now!

Get it on Google Play Download on the App Store Now


Source:  OpenStax, College physics. OpenStax CNX. Jul 27, 2015 Download for free at http://legacy.cnx.org/content/col11406/1.9
Google Play and the Google Play logo are trademarks of Google Inc.

Notification Switch

Would you like to follow the 'College physics' conversation and receive update notifications?

Ask