<< Chapter < Page Chapter >> Page >
  • Describe a straight-line graph in terms of its slope and y -intercept.
  • Determine average velocity or instantaneous velocity from a graph of position vs. time.
  • Determine average or instantaneous acceleration from a graph of velocity vs. time.
  • Derive a graph of velocity vs. time from a graph of position vs. time.
  • Derive a graph of acceleration vs. time from a graph of velocity vs. time.

A graph, like a picture, is worth a thousand words. Graphs not only contain numerical information; they also reveal relationships between physical quantities. This section uses graphs of displacement, velocity, and acceleration versus time to illustrate one-dimensional kinematics.

Slopes and general relationships

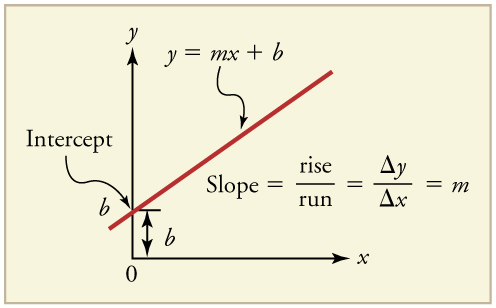
First note that graphs in this text have perpendicular axes, one horizontal and the other vertical. When two physical quantities are plotted against one another in such a graph, the horizontal axis is usually considered to be an independent variable    and the vertical axis a dependent variable    . If we call the horizontal axis the x size 12{x} {} -axis and the vertical axis the y size 12{y} {} -axis, as in [link] , a straight-line graph has the general form

y = mx + b . size 12{y= ital "mx"+`b} {}

Here m size 12{m} {} is the slope    , defined to be the rise divided by the run (as seen in the figure) of the straight line. The letter b size 12{b} {} is used for the y -intercept , which is the point at which the line crosses the vertical axis.

Graph of a straight-line sloping up at about 40 degrees.
A straight-line graph. The equation for a straight line is y = mx + b size 12{y= ital "mx"+b} {} .

Graph of displacement vs. time ( a = 0, so v Is constant)

Time is usually an independent variable that other quantities, such as displacement, depend upon. A graph of displacement versus time would, thus, have x size 12{x} {} on the vertical axis and t size 12{t} {} on the horizontal axis. [link] is just such a straight-line graph. It shows a graph of displacement versus time for a jet-powered car on a very flat dry lake bed in Nevada.

Line graph of jet car displacement in meters versus time in seconds. The line is straight with a positive slope. The y intercept is four hundred meters. The total change in time is eight point zero seconds. The initial position is four hundred meters. The final position is two thousand meters.
Graph of displacement versus time for a jet-powered car on the Bonneville Salt Flats.

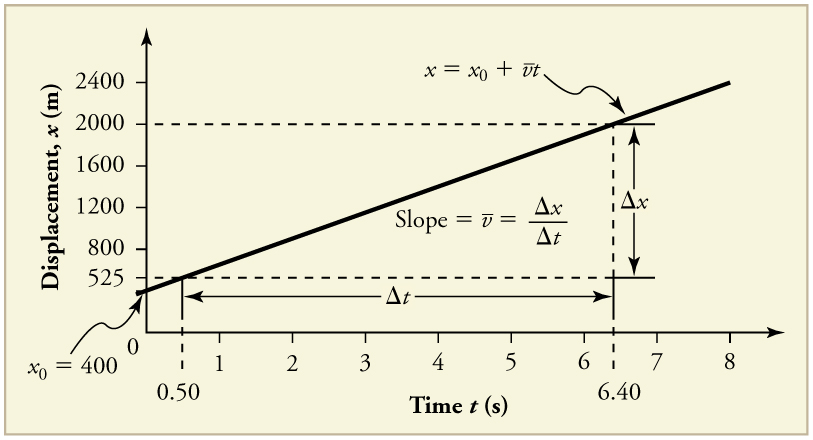
Using the relationship between dependent and independent variables, we see that the slope in the graph above is average velocity v - size 12{ { bar {v}}} {} and the intercept is displacement at time zero—that is, x 0 size 12{x rSub { size 8{0} } } {} . Substituting these symbols into y = mx + b size 12{y= ital "mx"+b} {} gives

x = v - t + x 0 size 12{x= { bar {v}}t+x rSub { size 8{0} } } {}

or

x = x 0 + v - t . size 12{x=x rSub { size 8{0} } + { bar {v}}t} {}

Thus a graph of displacement versus time gives a general relationship among displacement, velocity, and time, as well as giving detailed numerical information about a specific situation.

The slope of x Vs. t

The slope of the graph of displacement x size 12{x} {} vs. time t size 12{t} {} is velocity v size 12{v} {} .

slope = Δ x Δ t = v

Notice that this equation is the same as that derived algebraically from other motion equations in Motion Equations for Constant Acceleration in One Dimension .

From the figure we can see that the car has a displacement of 25 m at 0.50 s and 2000 m at 6.40 s. Its displacement at other times can be read from the graph; furthermore, information about its velocity and acceleration can also be obtained from the graph.

Determining average velocity from a graph of displacement versus time: jet car

Find the average velocity of the car whose position is graphed in [link] .

Strategy

The slope of a graph of x size 12{x} {} vs. t size 12{t} {} is average velocity, since slope equals rise over run. In this case, rise = change in displacement and run = change in time, so that

slope = Δ x Δ t = v - .

Since the slope is constant here, any two points on the graph can be used to find the slope. (Generally speaking, it is most accurate to use two widely separated points on the straight line. This is because any error in reading data from the graph is proportionally smaller if the interval is larger.)

Solution

1. Choose two points on the line. In this case, we choose the points labeled on the graph: (6.4 s, 2000 m) and (0.50 s, 525 m). (Note, however, that you could choose any two points.)

2. Substitute the x and t values of the chosen points into the equation. Remember in calculating change ( Δ ) size 12{ \( Δ \) } {} we always use final value minus initial value.

v - = Δ x Δ t = 2000 m 525 m 6 . 4 s 0 . 50 s , size 12{ { bar {v}}= { {Δx} over {Δt} } = { {"2000 m" - "525 m"} over {6 "." "4 s" - 0 "." "50 s"} } } {}

yielding

v - = 250 m/s . size 12{ { bar {v}}="250 m/s"} {}

Discussion

This is an impressively large land speed (900 km/h, or about 560 mi/h): much greater than the typical highway speed limit of 60 mi/h (27 m/s or 96 km/h), but considerably shy of the record of 343 m/s (1234 km/h or 766 mi/h) set in 1997.

Got questions? Get instant answers now!

Questions & Answers

Ayele, K., 2003. Introductory Economics, 3rd ed., Addis Ababa.
Widad Reply
can you send the book attached ?
Ariel
?
Ariel
What is economics
Widad Reply
the study of how humans make choices under conditions of scarcity
AI-Robot
U(x,y) = (x×y)1/2 find mu of x for y
Desalegn Reply
U(x,y) = (x×y)1/2 find mu of x for y
Desalegn
what is ecnomics
Jan Reply
this is the study of how the society manages it's scarce resources
Belonwu
what is macroeconomic
John Reply
macroeconomic is the branch of economics which studies actions, scale, activities and behaviour of the aggregate economy as a whole.
husaini
etc
husaini
difference between firm and industry
husaini Reply
what's the difference between a firm and an industry
Abdul
firm is the unit which transform inputs to output where as industry contain combination of firms with similar production 😅😅
Abdulraufu
Suppose the demand function that a firm faces shifted from Qd  120 3P to Qd  90  3P and the supply function has shifted from QS  20  2P to QS 10  2P . a) Find the effect of this change on price and quantity. b) Which of the changes in demand and supply is higher?
Toofiq Reply
explain standard reason why economic is a science
innocent Reply
factors influencing supply
Petrus Reply
what is economic.
Milan Reply
scares means__________________ends resources. unlimited
Jan
economics is a science that studies human behaviour as a relationship b/w ends and scares means which have alternative uses
Jan
calculate the profit maximizing for demand and supply
Zarshad Reply
Why qualify 28 supplies
Milan
what are explicit costs
Nomsa Reply
out-of-pocket costs for a firm, for example, payments for wages and salaries, rent, or materials
AI-Robot
concepts of supply in microeconomics
David Reply
economic overview notes
Amahle Reply
identify a demand and a supply curve
Salome Reply
i don't know
Parul
there's a difference
Aryan
Demand curve shows that how supply and others conditions affect on demand of a particular thing and what percent demand increase whith increase of supply of goods
Israr
Hi Sir please how do u calculate Cross elastic demand and income elastic demand?
Abari
Got questions? Join the online conversation and get instant answers!
Jobilize.com Reply
Practice Key Terms 4

Get Jobilize Job Search Mobile App in your pocket Now!

Get it on Google Play Download on the App Store Now


Source:  OpenStax, College physics. OpenStax CNX. Jul 27, 2015 Download for free at http://legacy.cnx.org/content/col11406/1.9
Google Play and the Google Play logo are trademarks of Google Inc.

Notification Switch

Would you like to follow the 'College physics' conversation and receive update notifications?

Ask