<< Chapter < Page Chapter >> Page >
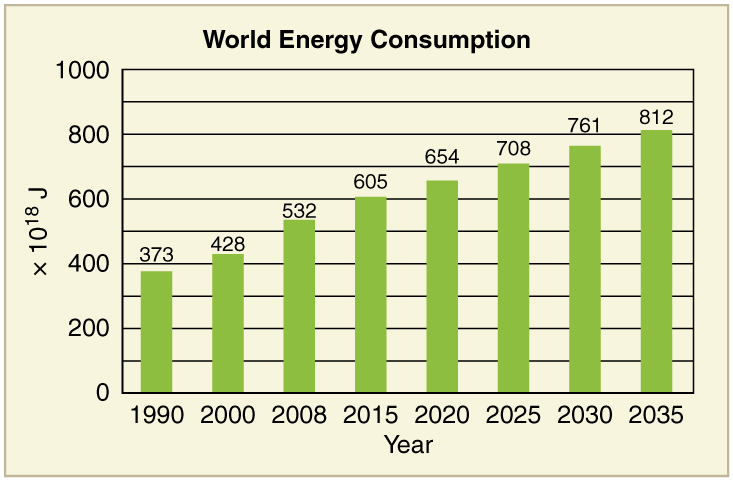
A bar graph depicting world energy consumption is shown. The year is listed on the horizontal axis and energy consumed is listed on the vertical axis. Energy consumption by the world is shown for different years. Energy consumption rises over time. In the year nineteen hundred and ninety it was three hundred seventy three multiplied by ten to the power eighteen joules, and the projection is that it will become eight hundred twelve multiplied by ten to the power eighteen joules by the year twenty thirty five.
Past and projected world energy use (source: Based on data from U.S. Energy Information Administration, 2011)
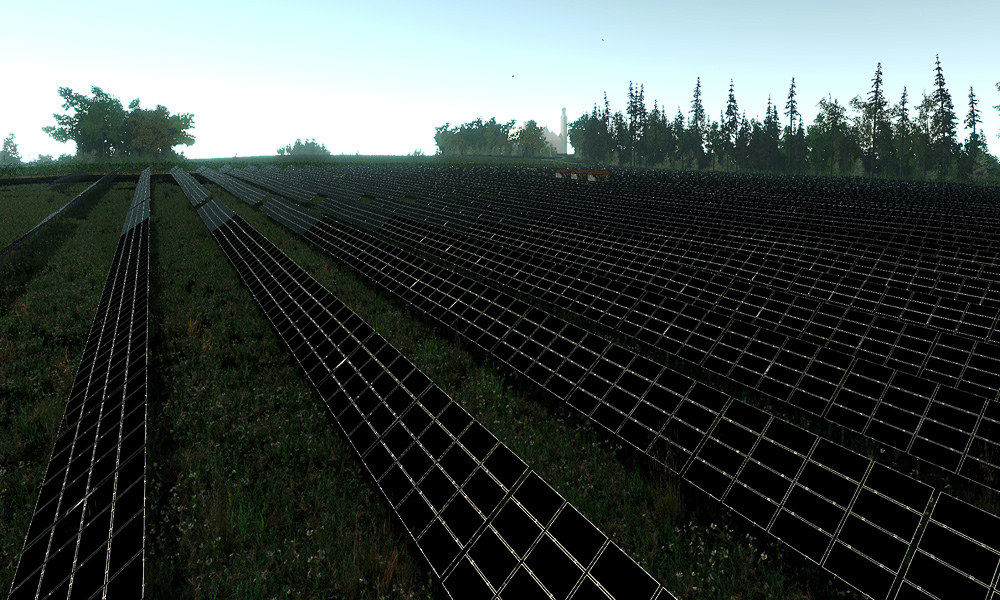
Solar cell arrays lined up in a field.
Solar cell arrays at a power plant in Steindorf, Germany (credit: Michael Betke, Flickr)

[link] displays the 2006 commercial energy mix by country for some of the prime energy users in the world. While non-renewable sources dominate, some countries get a sizeable percentage of their electricity from renewable resources. For example, about 67% of New Zealand’s electricity demand is met by hydroelectric. Only 10% of the U.S. electricity is generated by renewable resources, primarily hydroelectric. It is difficult to determine total contributions of renewable energy in some countries with a large rural population, so these percentages in this table are left blank.

Energy consumption—selected countries (2006)
Country Consumption, in EJ (10 18 J) Oil Natural Gas Coal Nuclear Hydro Other Renewables Electricity Use per capita (kWh/yr) Energy Use per capita (GJ/yr)
Australia 5.4 34% 17% 44% 0% 3% 1% 10000 260
Brazil 9.6 48% 7% 5% 1% 35% 2% 2000 50
China 63 22% 3% 69% 1% 6% 1500 35
Egypt 2.4 50% 41% 1% 0% 6% 990 32
Germany 16 37% 24% 24% 11% 1% 3% 6400 173
India 15 34% 7% 52% 1% 5% 470 13
Indonesia 4.9 51% 26% 16% 0% 2% 3% 420 22
Japan 24 48% 14% 21% 12% 4% 1% 7100 176
New Zealand 0.44 32% 26% 6% 0% 11% 19% 8500 102
Russia 31 19% 53% 16% 5% 6% 5700 202
U.S. 105 40% 23% 22% 8% 3% 1% 12500 340
World 432 39% 23% 24% 6% 6% 2% 2600 71

Energy and economic well-being

The last two columns in this table examine the energy and electricity use per capita. Economic well-being is dependent upon energy use, and in most countries higher standards of living, as measured by GDP (gross domestic product) per capita, are matched by higher levels of energy consumption per capita. This is borne out in [link] . Increased efficiency of energy use will change this dependency. A global problem is balancing energy resource development against the harmful effects upon the environment in its extraction and use.
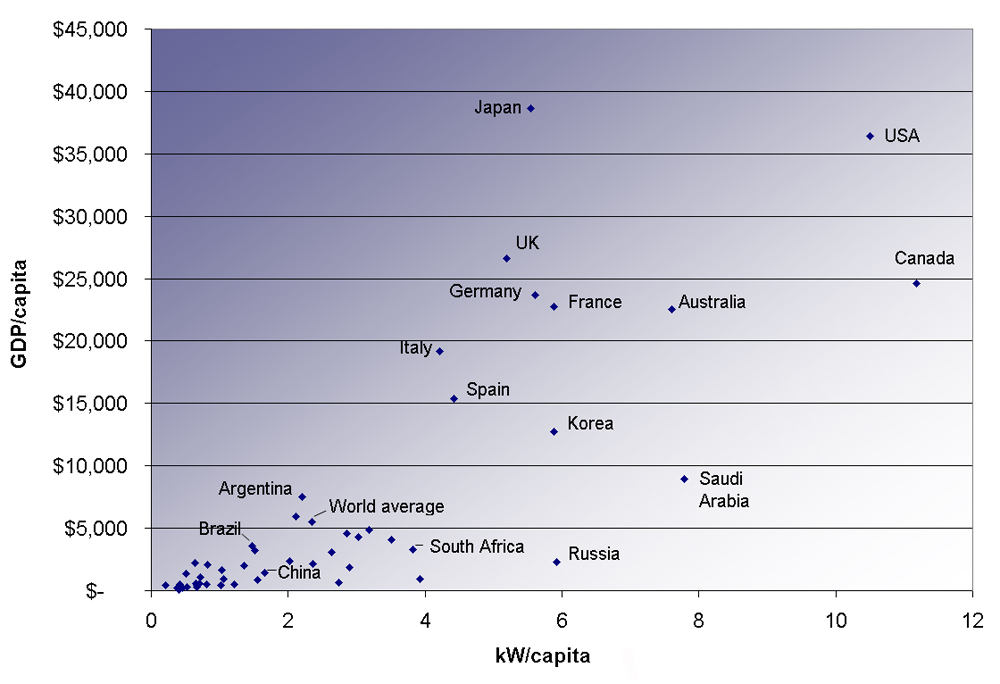
A scatter plot of power consumption per capita versus G D P per capita for various countries. Power consumption in kilowatt per capita is shown along the horizontal axis and G D P per capita is show along the vertical axis.
Power consumption per capita versus GDP per capita for various countries. Note the increase in energy usage with increasing GDP. (2007, credit: Frank van Mierlo, Wikimedia Commons)

Conserving energy

As we finish this chapter on energy and work, it is relevant to draw some distinctions between two sometimes misunderstood terms in the area of energy use. As has been mentioned elsewhere, the “law of the conservation of energy” is a very useful principle in analyzing physical processes. It is a statement that cannot be proven from basic principles, but is a very good bookkeeping device, and no exceptions have ever been found. It states that the total amount of energy in an isolated system will always remain constant. Related to this principle, but remarkably different from it, is the important philosophy of energy conservation. This concept has to do with seeking to decrease the amount of energy used by an individual or group through (1) reduced activities (e.g., turning down thermostats, driving fewer kilometers) and/or (2) increasing conversion efficiencies in the performance of a particular task—such as developing and using more efficient room heaters, cars that have greater miles-per-gallon ratings, energy-efficient compact fluorescent lights, etc.

Questions & Answers

how does Neisseria cause meningitis
Nyibol Reply
what is microbiologist
Muhammad Reply
what is errata
Muhammad
is the branch of biology that deals with the study of microorganisms.
Ntefuni Reply
What is microbiology
Mercy Reply
studies of microbes
Louisiaste
when we takee the specimen which lumbar,spin,
Ziyad Reply
How bacteria create energy to survive?
Muhamad Reply
Bacteria doesn't produce energy they are dependent upon their substrate in case of lack of nutrients they are able to make spores which helps them to sustain in harsh environments
_Adnan
But not all bacteria make spores, l mean Eukaryotic cells have Mitochondria which acts as powerhouse for them, since bacteria don't have it, what is the substitution for it?
Muhamad
they make spores
Louisiaste
what is sporadic nd endemic, epidemic
Aminu Reply
the significance of food webs for disease transmission
Abreham
food webs brings about an infection as an individual depends on number of diseased foods or carriers dully.
Mark
explain assimilatory nitrate reduction
Esinniobiwa Reply
Assimilatory nitrate reduction is a process that occurs in some microorganisms, such as bacteria and archaea, in which nitrate (NO3-) is reduced to nitrite (NO2-), and then further reduced to ammonia (NH3).
Elkana
This process is called assimilatory nitrate reduction because the nitrogen that is produced is incorporated in the cells of microorganisms where it can be used in the synthesis of amino acids and other nitrogen products
Elkana
Examples of thermophilic organisms
Shu Reply
Give Examples of thermophilic organisms
Shu
advantages of normal Flora to the host
Micheal Reply
Prevent foreign microbes to the host
Abubakar
they provide healthier benefits to their hosts
ayesha
They are friends to host only when Host immune system is strong and become enemies when the host immune system is weakened . very bad relationship!
Mark
what is cell
faisal Reply
cell is the smallest unit of life
Fauziya
cell is the smallest unit of life
Akanni
ok
Innocent
cell is the structural and functional unit of life
Hasan
is the fundamental units of Life
Musa
what are emergency diseases
Micheal Reply
There are nothing like emergency disease but there are some common medical emergency which can occur simultaneously like Bleeding,heart attack,Breathing difficulties,severe pain heart stock.Hope you will get my point .Have a nice day ❣️
_Adnan
define infection ,prevention and control
Innocent
I think infection prevention and control is the avoidance of all things we do that gives out break of infections and promotion of health practices that promote life
Lubega
Heyy Lubega hussein where are u from?
_Adnan
en français
Adama
which site have a normal flora
ESTHER Reply
Many sites of the body have it Skin Nasal cavity Oral cavity Gastro intestinal tract
Safaa
skin
Asiina
skin,Oral,Nasal,GIt
Sadik
How can Commensal can Bacteria change into pathogen?
Sadik
How can Commensal Bacteria change into pathogen?
Sadik
all
Tesfaye
by fussion
Asiina
what are the advantages of normal Flora to the host
Micheal
what are the ways of control and prevention of nosocomial infection in the hospital
Micheal
what is inflammation
Shelly Reply
part of a tissue or an organ being wounded or bruised.
Wilfred
what term is used to name and classify microorganisms?
Micheal Reply
Binomial nomenclature
adeolu
Got questions? Join the online conversation and get instant answers!
Jobilize.com Reply
Practice Key Terms 2

Get Jobilize Job Search Mobile App in your pocket Now!

Get it on Google Play Download on the App Store Now


Source:  OpenStax, College physics. OpenStax CNX. Jul 27, 2015 Download for free at http://legacy.cnx.org/content/col11406/1.9
Google Play and the Google Play logo are trademarks of Google Inc.

Notification Switch

Would you like to follow the 'College physics' conversation and receive update notifications?

Ask