<< Chapter < Page Chapter >> Page >

Solution for Remaining Times

The procedures for calculating the position and velocity at t = 2 . 00 s size 12{t=2 "." "00"`s} {} and 3 . 00 s size 12{3 "." "00 s"} {} are the same as those above. The results are summarized in [link] and illustrated in [link] .

Results
Time, t Position, y Velocity, v Acceleration, a
1 . 00 s size 12{1 "." "00 s"} {} 8 . 10 m size 12{8 "." "10 m"} {} 3 . 20 m/s size 12{3 "." "20 m/s"} {} 9 . 80 m/s 2 size 12{-9 "." "80 m/s" rSup { size 8{2} } } {}
2 . 00 s size 12{2 "." "00 s"} {} 6 . 40 m size 12{6 "." "40 m"} {} 6 . 60 m/s size 12{ - 6 "." "60 m/s"} {} 9 . 80 m/s 2 size 12{-9 "." "80 m/s" rSup { size 8{2} } } {}
3 . 00 s size 12{3 "." "00 s"} {} 5 . 10 m size 12{ - 5 "." "10 m"} {} 16 . 4 m/s size 12{ - "16" "." "4 m/s"} {} 9 . 80 m/s 2 size 12{-9 "." "80 m/s" rSup { size 8{2} } } {}

Graphing the data helps us understand it more clearly.
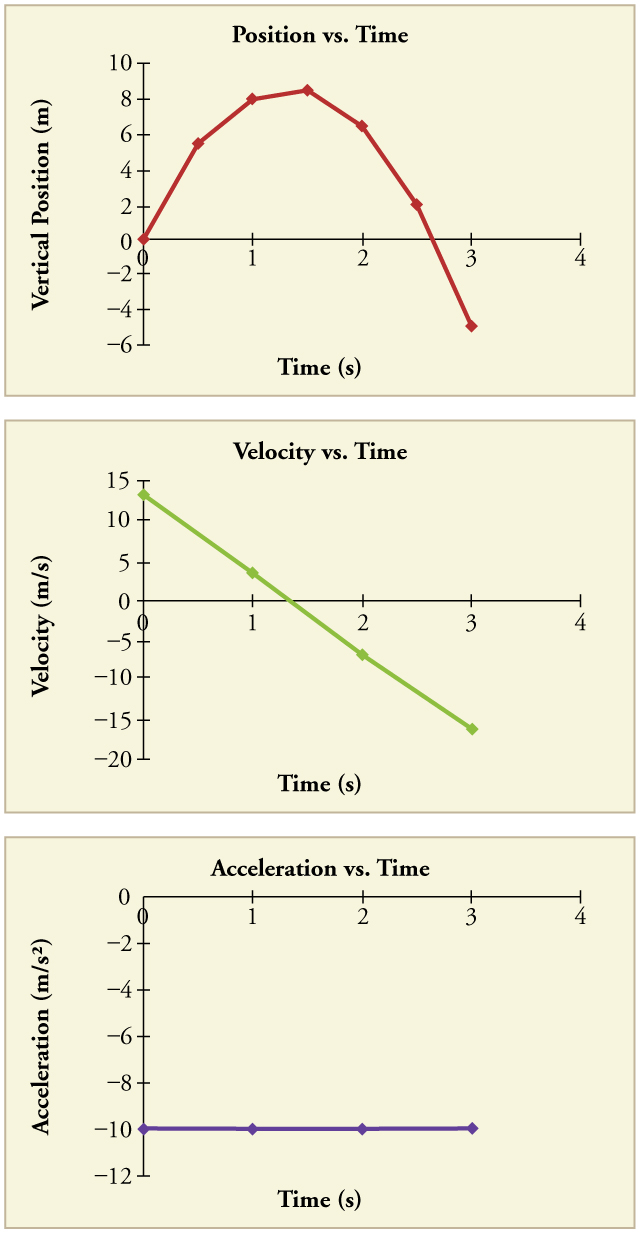
Three panels showing three graphs. The top panel shows a graph of vertical position in meters versus time in seconds. The line begins at the origin and has a positive slope that decreases over time until it hits a turning point between seconds 1 and 2. After that it has a negative slope that increases over time. The middle panel shows a graph of velocity in meters per second versus time in seconds. The line is straight, with a negative slope, beginning at time zero velocity of thirteen meters per second and ending at time 3 seconds with a velocity just over negative sixteen meters per second. The bottom panel shows a graph of acceleration in meters per second squared versus time in seconds. The line is straight and flat at a y value of negative 9 point 80 meters per second squared from time 0 to time 3 seconds.
Vertical position, vertical velocity, and vertical acceleration vs. time for a rock thrown vertically up at the edge of a cliff. Notice that velocity changes linearly with time and that acceleration is constant. Misconception Alert! Notice that the position vs. time graph shows vertical position only. It is easy to get the impression that the graph shows some horizontal motion—the shape of the graph looks like the path of a projectile. But this is not the case; the horizontal axis is time , not space. The actual path of the rock in space is straight up, and straight down.

Discussion

The interpretation of these results is important. At 1.00 s the rock is above its starting point and heading upward, since y 1 size 12{y rSub { size 8{1} } } {} and v 1 size 12{v rSub { size 8{1} } } {} are both positive. At 2.00 s, the rock is still above its starting point, but the negative velocity means it is moving downward. At 3.00 s, both y 3 size 12{y rSub { size 8{3} } } {} and v 3 size 12{v rSub { size 8{3} } } {} are negative, meaning the rock is below its starting point and continuing to move downward. Notice that when the rock is at its highest point (at 1.5 s), its velocity is zero, but its acceleration is still 9 . 80 m/s 2 size 12{-9 "." "80 m/s" rSup { size 8{2} } } {} . Its acceleration is 9 . 80 m/s 2 size 12{-9 "." "80 m/s" rSup { size 8{2} } } {} for the whole trip—while it is moving up and while it is moving down. Note that the values for y size 12{y} {} are the positions (or displacements) of the rock, not the total distances traveled. Finally, note that free-fall applies to upward motion as well as downward. Both have the same acceleration—the acceleration due to gravity, which remains constant the entire time. Astronauts training in the famous Vomit Comet, for example, experience free-fall while arcing up as well as down, as we will discuss in more detail later.

Making connections: take-home experiment—reaction time

A simple experiment can be done to determine your reaction time. Have a friend hold a ruler between your thumb and index finger, separated by about 1 cm. Note the mark on the ruler that is right between your fingers. Have your friend drop the ruler unexpectedly, and try to catch it between your two fingers. Note the new reading on the ruler. Assuming acceleration is that due to gravity, calculate your reaction time. How far would you travel in a car (moving at 30 m/s) if the time it took your foot to go from the gas pedal to the brake was twice this reaction time?

Calculating velocity of a falling object: a rock thrown down

What happens if the person on the cliff throws the rock straight down, instead of straight up? To explore this question, calculate the velocity of the rock when it is 5.10 m below the starting point, and has been thrown downward with an initial speed of 13.0 m/s.

Strategy

Draw a sketch.

Velocity vector arrow pointing down in the negative y direction and labeled v sub zero equals negative thirteen point 0 meters per second. Acceleration vector arrow also pointing down in the negative y direction, labeled a equals negative 9 point 80 meters per second squared.

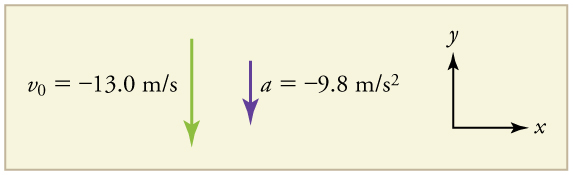
Since up is positive, the final position of the rock will be negative because it finishes below the starting point at y 0 = 0 size 12{y rSub { size 8{0} } =0} {} . Similarly, the initial velocity is downward and therefore negative, as is the acceleration due to gravity. We expect the final velocity to be negative since the rock will continue to move downward.

Questions & Answers

Ayele, K., 2003. Introductory Economics, 3rd ed., Addis Ababa.
Widad Reply
can you send the book attached ?
Ariel
?
Ariel
What is economics
Widad Reply
the study of how humans make choices under conditions of scarcity
AI-Robot
U(x,y) = (x×y)1/2 find mu of x for y
Desalegn Reply
U(x,y) = (x×y)1/2 find mu of x for y
Desalegn
what is ecnomics
Jan Reply
this is the study of how the society manages it's scarce resources
Belonwu
what is macroeconomic
John Reply
macroeconomic is the branch of economics which studies actions, scale, activities and behaviour of the aggregate economy as a whole.
husaini
etc
husaini
difference between firm and industry
husaini Reply
what's the difference between a firm and an industry
Abdul
firm is the unit which transform inputs to output where as industry contain combination of firms with similar production 😅😅
Abdulraufu
Suppose the demand function that a firm faces shifted from Qd  120 3P to Qd  90  3P and the supply function has shifted from QS  20  2P to QS 10  2P . a) Find the effect of this change on price and quantity. b) Which of the changes in demand and supply is higher?
Toofiq Reply
explain standard reason why economic is a science
innocent Reply
factors influencing supply
Petrus Reply
what is economic.
Milan Reply
scares means__________________ends resources. unlimited
Jan
economics is a science that studies human behaviour as a relationship b/w ends and scares means which have alternative uses
Jan
calculate the profit maximizing for demand and supply
Zarshad Reply
Why qualify 28 supplies
Milan
what are explicit costs
Nomsa Reply
out-of-pocket costs for a firm, for example, payments for wages and salaries, rent, or materials
AI-Robot
concepts of supply in microeconomics
David Reply
economic overview notes
Amahle Reply
identify a demand and a supply curve
Salome Reply
i don't know
Parul
there's a difference
Aryan
Demand curve shows that how supply and others conditions affect on demand of a particular thing and what percent demand increase whith increase of supply of goods
Israr
Hi Sir please how do u calculate Cross elastic demand and income elastic demand?
Abari
Got questions? Join the online conversation and get instant answers!
Jobilize.com Reply
Practice Key Terms 2

Get Jobilize Job Search Mobile App in your pocket Now!

Get it on Google Play Download on the App Store Now


Source:  OpenStax, College physics. OpenStax CNX. Jul 27, 2015 Download for free at http://legacy.cnx.org/content/col11406/1.9
Google Play and the Google Play logo are trademarks of Google Inc.

Notification Switch

Would you like to follow the 'College physics' conversation and receive update notifications?

Ask