<< Chapter < Page Chapter >> Page >

Bohr’s solution for hydrogen

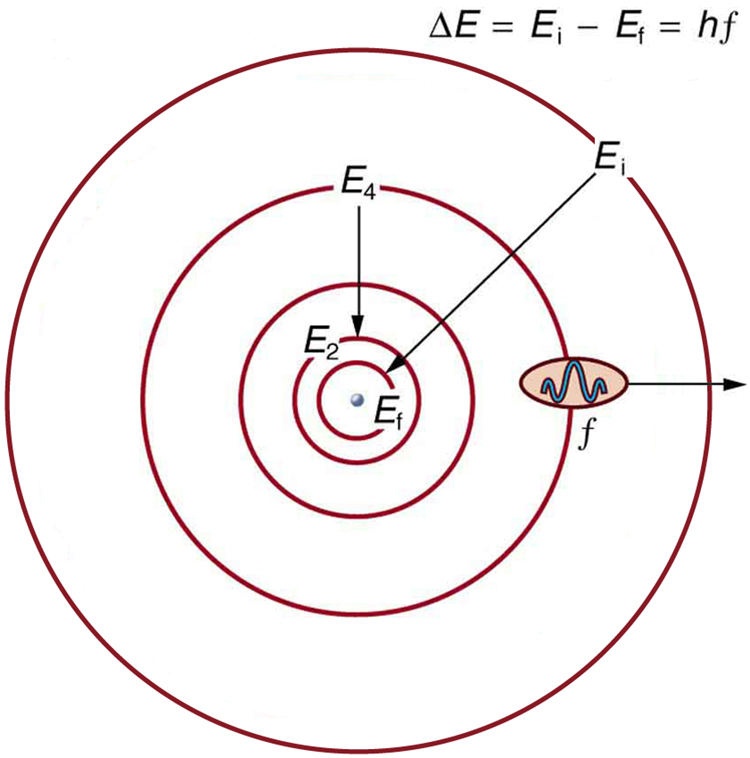
Bohr was able to derive the formula for the hydrogen spectrum using basic physics, the planetary model of the atom, and some very important new proposals. His first proposal is that only certain orbits are allowed: we say that the orbits of electrons in atoms are quantized . Each orbit has a different energy, and electrons can move to a higher orbit by absorbing energy and drop to a lower orbit by emitting energy. If the orbits are quantized, the amount of energy absorbed or emitted is also quantized, producing discrete spectra. Photon absorption and emission are among the primary methods of transferring energy into and out of atoms. The energies of the photons are quantized, and their energy is explained as being equal to the change in energy of the electron when it moves from one orbit to another. In equation form, this is

Δ E = hf = E i E f . size 12{ΔE= ital "hf"=E rSub { size 8{i} } - E rSub { size 8{f} } } {}

Here, Δ E size 12{ΔE} {} is the change in energy between the initial and final orbits, and hf size 12{ ital "hf"} {} is the energy of the absorbed or emitted photon. It is quite logical (that is, expected from our everyday experience) that energy is involved in changing orbits. A blast of energy is required for the space shuttle, for example, to climb to a higher orbit. What is not expected is that atomic orbits should be quantized. This is not observed for satellites or planets, which can have any orbit given the proper energy. (See [link] .)

The orbits of Bohr’s planetary model of an atom; five concentric circles are shown. The radii of the circles increase from innermost to outermost circles. On the circles, labels E sub one, E sub two, up to E sub i are marked.
The planetary model of the atom, as modified by Bohr, has the orbits of the electrons quantized. Only certain orbits are allowed, explaining why atomic spectra are discrete (quantized). The energy carried away from an atom by a photon comes from the electron dropping from one allowed orbit to another and is thus quantized. This is likewise true for atomic absorption of photons.

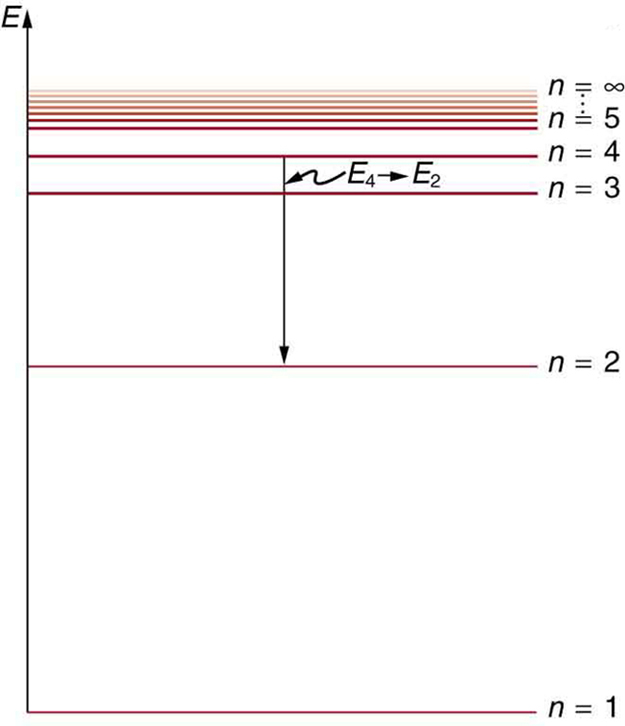
[link] shows an energy-level diagram    , a convenient way to display energy states. In the present discussion, we take these to be the allowed energy levels of the electron. Energy is plotted vertically with the lowest or ground state at the bottom and with excited states above. Given the energies of the lines in an atomic spectrum, it is possible (although sometimes very difficult) to determine the energy levels of an atom. Energy-level diagrams are used for many systems, including molecules and nuclei. A theory of the atom or any other system must predict its energies based on the physics of the system.

The energy level diagram is shown. A number of horizontal lines are shown. The lines are labeled from bottom to top as n is equal to one, n is equal to two and so on up to n equals infinity; the energy levels increase from bottom to top. The distance between the lines decreases from the bottom line to the top line. A vertical arrow shows an electron transitioning from n equals four to n equals two.
An energy-level diagram plots energy vertically and is useful in visualizing the energy states of a system and the transitions between them. This diagram is for the hydrogen-atom electrons, showing a transition between two orbits having energies E 4 size 12{E rSub { size 8{4} } } {} and E 2 size 12{E rSub { size 8{2} } } {} .

Bohr was clever enough to find a way to calculate the electron orbital energies in hydrogen. This was an important first step that has been improved upon, but it is well worth repeating here, because it does correctly describe many characteristics of hydrogen. Assuming circular orbits, Bohr proposed that the angular momentum L size 12{L} {} of an electron in its orbit is quantized , that is, it has only specific, discrete values. The value for L size 12{L} {} is given by the formula

Questions & Answers

how do you get the 2/50
Abba Reply
number of sport play by 50 student construct discrete data
Aminu Reply
width of the frangebany leaves on how to write a introduction
Theresa Reply
Solve the mean of variance
Veronica Reply
Step 1: Find the mean. To find the mean, add up all the scores, then divide them by the number of scores. ... Step 2: Find each score's deviation from the mean. ... Step 3: Square each deviation from the mean. ... Step 4: Find the sum of squares. ... Step 5: Divide the sum of squares by n – 1 or N.
kenneth
what is error
Yakuba Reply
Is mistake done to something
Vutshila
Hy
anas
hy
What is the life teble
anas
hy
Jibrin
statistics is the analyzing of data
Tajudeen Reply
what is statics?
Zelalem Reply
how do you calculate mean
Gloria Reply
diveving the sum if all values
Shaynaynay
let A1,A2 and A3 events be independent,show that (A1)^c, (A2)^c and (A3)^c are independent?
Fisaye Reply
what is statistics
Akhisani Reply
data collected all over the world
Shaynaynay
construct a less than and more than table
Imad Reply
The sample of 16 students is taken. The average age in the sample was 22 years with astandard deviation of 6 years. Construct a 95% confidence interval for the age of the population.
Aschalew Reply
Bhartdarshan' is an internet-based travel agency wherein customer can see videos of the cities they plant to visit. The number of hits daily is a normally distributed random variable with a mean of 10,000 and a standard deviation of 2,400 a. what is the probability of getting more than 12,000 hits? b. what is the probability of getting fewer than 9,000 hits?
Akshay Reply
Bhartdarshan'is an internet-based travel agency wherein customer can see videos of the cities they plan to visit. The number of hits daily is a normally distributed random variable with a mean of 10,000 and a standard deviation of 2,400. a. What is the probability of getting more than 12,000 hits
Akshay
1
Bright
Sorry i want to learn more about this question
Bright
Someone help
Bright
a= 0.20233 b=0.3384
Sufiyan
a
Shaynaynay
How do I interpret level of significance?
Mohd Reply
It depends on your business problem or in Machine Learning you could use ROC- AUC cruve to decide the threshold value
Shivam
how skewness and kurtosis are used in statistics
Owen Reply
yes what is it
Taneeya
Got questions? Join the online conversation and get instant answers!
Jobilize.com Reply
Practice Key Terms 7

Get Jobilize Job Search Mobile App in your pocket Now!

Get it on Google Play Download on the App Store Now


Source:  OpenStax, College physics. OpenStax CNX. Jul 27, 2015 Download for free at http://legacy.cnx.org/content/col11406/1.9
Google Play and the Google Play logo are trademarks of Google Inc.

Notification Switch

Would you like to follow the 'College physics' conversation and receive update notifications?

Ask