<< Chapter < Page Chapter >> Page >

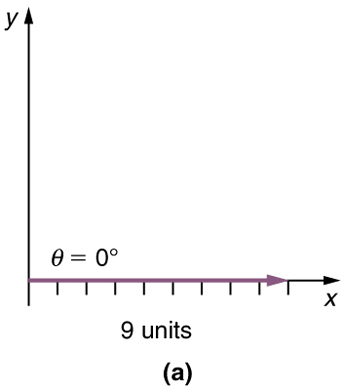
Step 1. Draw an arrow to represent the first vector (9 blocks to the east) using a ruler and protractor .

In part a, a vector of magnitude of nine units and making an angle theta is equal to zero degree is drawn from the origin and along the positive direction of x axis.

Step 2. Now draw an arrow to represent the second vector (5 blocks to the north). Place the tail of the second vector at the head of the first vector .

In part b, a vector of magnitude of nine units and making an angle theta is equal to zero degree is drawn from the origin and along the positive direction of x axis. Then a vertical vector from the head of the horizontal vector is drawn.

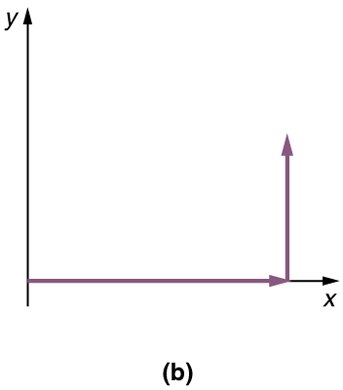
Step 3. If there are more than two vectors, continue this process for each vector to be added. Note that in our example, we have only two vectors, so we have finished placing arrows tip to tail .

Step 4. Draw an arrow from the tail of the first vector to the head of the last vector . This is the resultant    , or the sum, of the other vectors.

In part c, a vector D of magnitude ten point three is drawn from the tail of the horizontal vector at an angle theta is equal to twenty nine point one degrees from the positive direction of the x axis. The head of the vector D meets the head of the vertical vector. A scale is shown parallel to the vector D to measure its length. Also a protractor is shown to measure the inclination of the vector D.

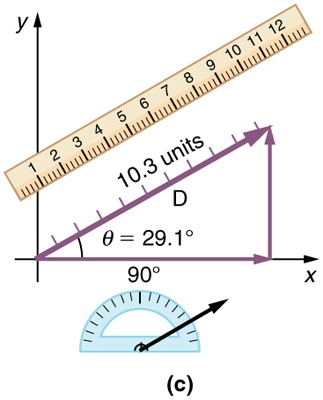
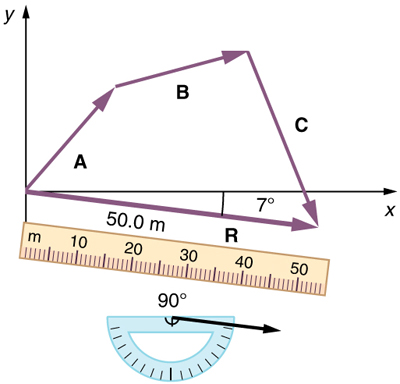
Step 5. To get the magnitude of the resultant, measure its length with a ruler. (Note that in most calculations, we will use the Pythagorean theorem to determine this length.)

Step 6. To get the direction of the resultant, measure the angle it makes with the reference frame using a protractor. (Note that in most calculations, we will use trigonometric relationships to determine this angle.)

The graphical addition of vectors is limited in accuracy only by the precision with which the drawings can be made and the precision of the measuring tools. It is valid for any number of vectors.

Adding vectors graphically using the head-to-tail method: a woman takes a walk

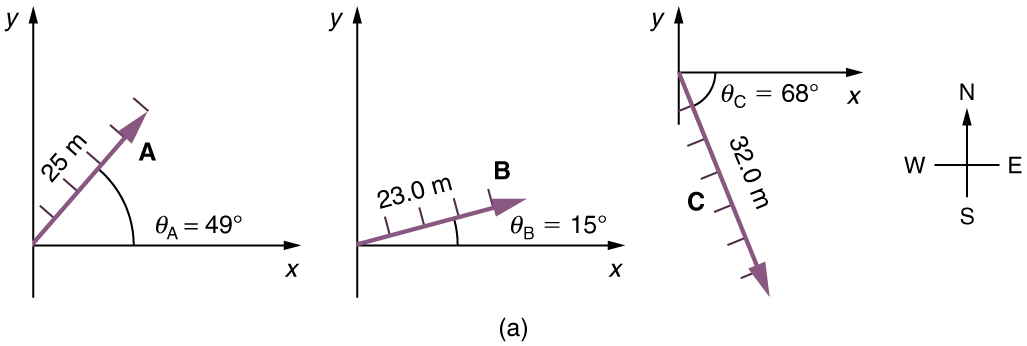
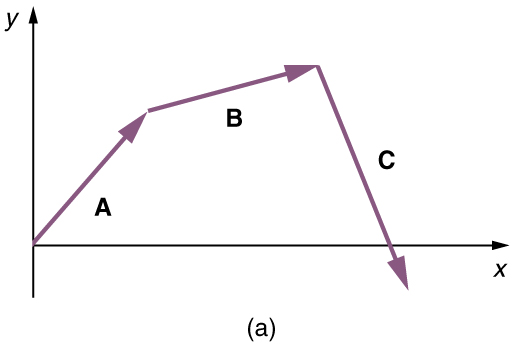
Use the graphical technique for adding vectors to find the total displacement of a person who walks the following three paths (displacements) on a flat field. First, she walks 25.0 m in a direction 49.0º size 12{"49" "." "0º"} {} north of east. Then, she walks 23.0 m heading 15.0º size 12{"15" "." "º°"} {} north of east. Finally, she turns and walks 32.0 m in a direction 68.0° south of east.

Strategy

Represent each displacement vector graphically with an arrow, labeling the first A size 12{A} {} , the second B size 12{B} {} , and the third C size 12{C} {} , making the lengths proportional to the distance and the directions as specified relative to an east-west line. The head-to-tail method outlined above will give a way to determine the magnitude and direction of the resultant displacement, denoted R size 12{R} {} .

Solution

(1) Draw the three displacement vectors.

On the graph a vector of magnitude twenty three meters and inclined above the x axis at an angle theta-b equal to fifteen degrees is shown. This vector is labeled as B.

(2) Place the vectors head to tail retaining both their initial magnitude and direction.
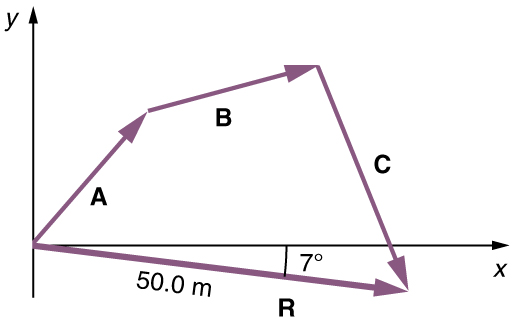
In this figure a vector A with a positive slope is drawn from the origin. Then from the head of the vector A another vector B with positive slope is drawn and then another vector C with negative slope from the head of the vector B is drawn which cuts the x axis.

(3) Draw the resultant vector, R size 12{R} {} .

In this figure a vector A with a positive slope is drawn from the origin. Then from the head of the vector A another vector B with positive slope is drawn and then another vector C with negative slope from the head of the vector B is drawn which cuts the x axis. From the tail of the vector A a vector R of magnitude of fifty point zero meters and with negative slope of seven degrees is drawn. The head of this vector R meets the head of the vector C. The vector R is known as the resultant vector.

(4) Use a ruler to measure the magnitude of R size 12{R} {} , and a protractor to measure the direction of R size 12{R} {} . While the direction of the vector can be specified in many ways, the easiest way is to measure the angle between the vector and the nearest horizontal or vertical axis. Since the resultant vector is south of the eastward pointing axis, we flip the protractor upside down and measure the angle between the eastward axis and the vector.

In this figure a vector A with a positive slope is drawn from the origin. Then from the head of the vector A another vector B with positive slope is drawn and then another vector C with negative slope from the head of the vector B is drawn which cuts the x axis. From the tail of the vector A a vector R of magnitude of fifty meter and with negative slope of seven degrees is drawn. The head of this vector R meets the head of the vector C. The vector R is known as the resultant vector. A ruler is placed along the vector R to measure it. Also there is a protractor to measure the angle.

In this case, the total displacement R size 12{R} {} is seen to have a magnitude of 50.0 m and to lie in a direction 7.0º size 12{7 "." 0°} {} south of east. By using its magnitude and direction, this vector can be expressed as R = 50.0 m size 12{R" = 50" "." "0 m"} {} and θ = 7 . size 12{θ=7 "." "0°"} {} south of east.

Discussion

The head-to-tail graphical method of vector addition works for any number of vectors. It is also important to note that the resultant is independent of the order in which the vectors are added. Therefore, we could add the vectors in any order as illustrated in [link] and we will still get the same solution.

Questions & Answers

how do you get the 2/50
Abba Reply
number of sport play by 50 student construct discrete data
Aminu Reply
width of the frangebany leaves on how to write a introduction
Theresa Reply
Solve the mean of variance
Veronica Reply
Step 1: Find the mean. To find the mean, add up all the scores, then divide them by the number of scores. ... Step 2: Find each score's deviation from the mean. ... Step 3: Square each deviation from the mean. ... Step 4: Find the sum of squares. ... Step 5: Divide the sum of squares by n – 1 or N.
kenneth
what is error
Yakuba Reply
Is mistake done to something
Vutshila
Hy
anas
hy
What is the life teble
anas
hy
Jibrin
statistics is the analyzing of data
Tajudeen Reply
what is statics?
Zelalem Reply
how do you calculate mean
Gloria Reply
diveving the sum if all values
Shaynaynay
let A1,A2 and A3 events be independent,show that (A1)^c, (A2)^c and (A3)^c are independent?
Fisaye Reply
what is statistics
Akhisani Reply
data collected all over the world
Shaynaynay
construct a less than and more than table
Imad Reply
The sample of 16 students is taken. The average age in the sample was 22 years with astandard deviation of 6 years. Construct a 95% confidence interval for the age of the population.
Aschalew Reply
Bhartdarshan' is an internet-based travel agency wherein customer can see videos of the cities they plant to visit. The number of hits daily is a normally distributed random variable with a mean of 10,000 and a standard deviation of 2,400 a. what is the probability of getting more than 12,000 hits? b. what is the probability of getting fewer than 9,000 hits?
Akshay Reply
Bhartdarshan'is an internet-based travel agency wherein customer can see videos of the cities they plan to visit. The number of hits daily is a normally distributed random variable with a mean of 10,000 and a standard deviation of 2,400. a. What is the probability of getting more than 12,000 hits
Akshay
1
Bright
Sorry i want to learn more about this question
Bright
Someone help
Bright
a= 0.20233 b=0.3384
Sufiyan
a
Shaynaynay
How do I interpret level of significance?
Mohd Reply
It depends on your business problem or in Machine Learning you could use ROC- AUC cruve to decide the threshold value
Shivam
how skewness and kurtosis are used in statistics
Owen Reply
yes what is it
Taneeya
Got questions? Join the online conversation and get instant answers!
Jobilize.com Reply

Get Jobilize Job Search Mobile App in your pocket Now!

Get it on Google Play Download on the App Store Now


Source:  OpenStax, College physics. OpenStax CNX. Jul 27, 2015 Download for free at http://legacy.cnx.org/content/col11406/1.9
Google Play and the Google Play logo are trademarks of Google Inc.

Notification Switch

Would you like to follow the 'College physics' conversation and receive update notifications?

Ask