<< Chapter < Page
  College physics   Page 1 / 1
Chapter >> Page >
Photograph of the reflective side of a C D. Regions of the disc reflect a rainbow of colors.
The colors reflected by this compact disc vary with angle and are not caused by pigments. Colors such as these are direct evidence of the wave character of light. (credit: Infopro, Wikimedia Commons)

Examine a compact disc under white light, noting the colors observed and locations of the colors. Determine if the spectra are formed by diffraction from circular lines centered at the middle of the disc and, if so, what is their spacing. If not, determine the type of spacing. Also with the CD, explore the spectra of a few light sources, such as a candle flame, incandescent bulb, halogen light, and fluorescent light. Knowing the spacing of the rows of pits in the compact disc, estimate the maximum spacing that will allow the given number of megabytes of information to be stored.

If you have ever looked at the reds, blues, and greens in a sunlit soap bubble and wondered how straw-colored soapy water could produce them, you have hit upon one of the many phenomena that can only be explained by the wave character of light (see [link] ). The same is true for the colors seen in an oil slick or in the light reflected from a compact disc. These and other interesting phenomena, such as the dispersion of white light into a rainbow of colors when passed through a narrow slit, cannot be explained fully by geometric optics. In these cases, light interacts with small objects and exhibits its wave characteristics. The branch of optics that considers the behavior of light when it exhibits wave characteristics (particularly when it interacts with small objects) is called wave optics (sometimes called physical optics). It is the topic of this chapter.
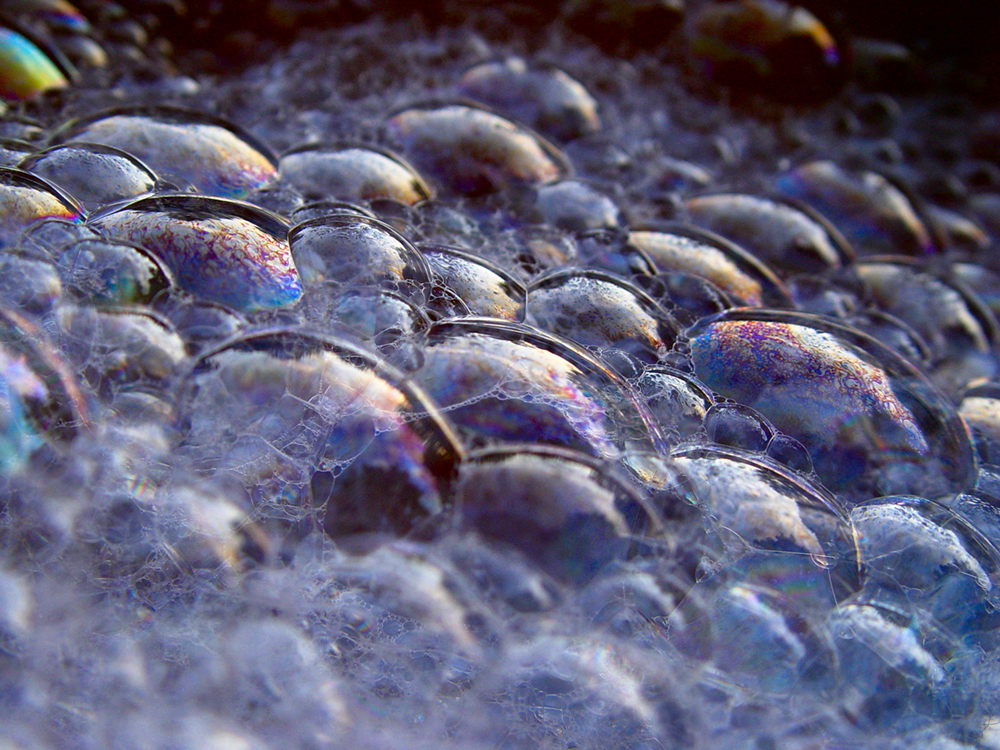
Soap bubbles reflecting mostly purple and blue light with some regions of orange.
These soap bubbles exhibit brilliant colors when exposed to sunlight. How are the colors produced if they are not pigments in the soap? (credit: Scott Robinson, Flickr)

Questions & Answers

how do you get the 2/50
Abba Reply
number of sport play by 50 student construct discrete data
Aminu Reply
width of the frangebany leaves on how to write a introduction
Theresa Reply
Solve the mean of variance
Veronica Reply
Step 1: Find the mean. To find the mean, add up all the scores, then divide them by the number of scores. ... Step 2: Find each score's deviation from the mean. ... Step 3: Square each deviation from the mean. ... Step 4: Find the sum of squares. ... Step 5: Divide the sum of squares by n – 1 or N.
kenneth
what is error
Yakuba Reply
Is mistake done to something
Vutshila
Hy
anas
hy
What is the life teble
anas
hy
Jibrin
statistics is the analyzing of data
Tajudeen Reply
what is statics?
Zelalem Reply
how do you calculate mean
Gloria Reply
diveving the sum if all values
Shaynaynay
let A1,A2 and A3 events be independent,show that (A1)^c, (A2)^c and (A3)^c are independent?
Fisaye Reply
what is statistics
Akhisani Reply
data collected all over the world
Shaynaynay
construct a less than and more than table
Imad Reply
The sample of 16 students is taken. The average age in the sample was 22 years with astandard deviation of 6 years. Construct a 95% confidence interval for the age of the population.
Aschalew Reply
Bhartdarshan' is an internet-based travel agency wherein customer can see videos of the cities they plant to visit. The number of hits daily is a normally distributed random variable with a mean of 10,000 and a standard deviation of 2,400 a. what is the probability of getting more than 12,000 hits? b. what is the probability of getting fewer than 9,000 hits?
Akshay Reply
Bhartdarshan'is an internet-based travel agency wherein customer can see videos of the cities they plan to visit. The number of hits daily is a normally distributed random variable with a mean of 10,000 and a standard deviation of 2,400. a. What is the probability of getting more than 12,000 hits
Akshay
1
Bright
Sorry i want to learn more about this question
Bright
Someone help
Bright
a= 0.20233 b=0.3384
Sufiyan
a
Shaynaynay
How do I interpret level of significance?
Mohd Reply
It depends on your business problem or in Machine Learning you could use ROC- AUC cruve to decide the threshold value
Shivam
how skewness and kurtosis are used in statistics
Owen Reply
yes what is it
Taneeya
Got questions? Join the online conversation and get instant answers!
Jobilize.com Reply

Get Jobilize Job Search Mobile App in your pocket Now!

Get it on Google Play Download on the App Store Now


Source:  OpenStax, College physics. OpenStax CNX. Jul 27, 2015 Download for free at http://legacy.cnx.org/content/col11406/1.9
Google Play and the Google Play logo are trademarks of Google Inc.

Notification Switch

Would you like to follow the 'College physics' conversation and receive update notifications?

Ask