<< Chapter < Page Chapter >> Page >
  • List the rules for ray tracking for thin lenses.
  • Illustrate the formation of images using the technique of ray tracking.
  • Determine power of a lens given the focal length.

Lenses are found in a huge array of optical instruments, ranging from a simple magnifying glass to the eye to a camera’s zoom lens. In this section, we will use the law of refraction to explore the properties of lenses and how they form images.

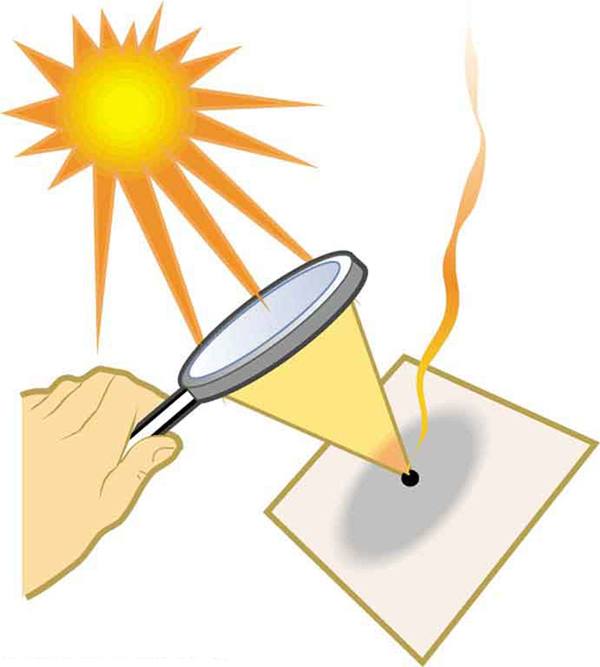
The word lens derives from the Latin word for a lentil bean, the shape of which is similar to the convex lens in [link] . The convex lens shown has been shaped so that all light rays that enter it parallel to its axis cross one another at a single point on the opposite side of the lens. (The axis is defined to be a line normal to the lens at its center, as shown in [link] .) Such a lens is called a converging (or convex) lens for the converging effect it has on light rays. An expanded view of the path of one ray through the lens is shown, to illustrate how the ray changes direction both as it enters and as it leaves the lens. Since the index of refraction of the lens is greater than that of air, the ray moves towards the perpendicular as it enters and away from the perpendicular as it leaves. (This is in accordance with the law of refraction.) Due to the lens’s shape, light is thus bent toward the axis at both surfaces. The point at which the rays cross is defined to be the focal point     F of the lens. The distance from the center of the lens to its focal point is defined to be the focal length     f size 12{f} {} of the lens. [link] shows how a converging lens, such as that in a magnifying glass, can converge the nearly parallel light rays from the sun to a small spot.

The figure on the right shows a convex lens. Three rays heading from left to right, 1, 2, and 3, are considered. Ray 2 falls on the axis and rays 1 and 3 are parallel to the axis. The distance from the center of the lens to the focal point F is small f on the right side of the lens. Rays 1 and 3 after refraction converge at F on the axis. Ray 2 on the axis goes undeviated. The figure on the left shows an expanded view of refraction for ray 1. The angle of incidence is theta 1 and angle of refraction theta 2 and a dotted line is the perpendicular drawn to the surface of the lens at the point of incidence. The ray after the refraction at the second surface emerges with an angle equal to theta 1 prime with the perpendicular drawn at that point. The perpendiculars are shown as dotted lines.
Rays of light entering a converging lens parallel to its axis converge at its focal point F. (Ray 2 lies on the axis of the lens.) The distance from the center of the lens to the focal point is the lens’s focal length f size 12{f} {} . An expanded view of the path taken by ray 1 shows the perpendiculars and the angles of incidence and refraction at both surfaces.

Converging or convex lens

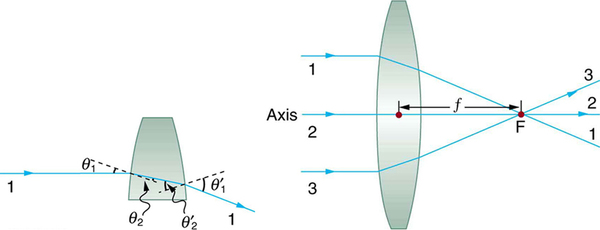
The lens in which light rays that enter it parallel to its axis cross one another at a single point on the opposite side with a converging effect is called converging lens.

Focal point f

The point at which the light rays cross is called the focal point F of the lens.

Focal length f size 12{f} {}

The distance from the center of the lens to its focal point is called focal length f size 12{f} {} .

A person’s hand is holding a magnifying glass to focus the sunlight to a point. The magnifying glass focuses the sunlight to burn paper.
Sunlight focused by a converging magnifying glass can burn paper. Light rays from the sun are nearly parallel and cross at the focal point of the lens. The more powerful the lens, the closer to the lens the rays will cross.

The greater effect a lens has on light rays, the more powerful it is said to be. For example, a powerful converging lens will focus parallel light rays closer to itself and will have a smaller focal length than a weak lens. The light will also focus into a smaller and more intense spot for a more powerful lens. The power     P size 12{P} {} of a lens is defined to be the inverse of its focal length. In equation form, this is

Questions & Answers

how do you get the 2/50
Abba Reply
number of sport play by 50 student construct discrete data
Aminu Reply
width of the frangebany leaves on how to write a introduction
Theresa Reply
Solve the mean of variance
Veronica Reply
Step 1: Find the mean. To find the mean, add up all the scores, then divide them by the number of scores. ... Step 2: Find each score's deviation from the mean. ... Step 3: Square each deviation from the mean. ... Step 4: Find the sum of squares. ... Step 5: Divide the sum of squares by n – 1 or N.
kenneth
what is error
Yakuba Reply
Is mistake done to something
Vutshila
Hy
anas
hy
What is the life teble
anas
hy
Jibrin
statistics is the analyzing of data
Tajudeen Reply
what is statics?
Zelalem Reply
how do you calculate mean
Gloria Reply
diveving the sum if all values
Shaynaynay
let A1,A2 and A3 events be independent,show that (A1)^c, (A2)^c and (A3)^c are independent?
Fisaye Reply
what is statistics
Akhisani Reply
data collected all over the world
Shaynaynay
construct a less than and more than table
Imad Reply
The sample of 16 students is taken. The average age in the sample was 22 years with astandard deviation of 6 years. Construct a 95% confidence interval for the age of the population.
Aschalew Reply
Bhartdarshan' is an internet-based travel agency wherein customer can see videos of the cities they plant to visit. The number of hits daily is a normally distributed random variable with a mean of 10,000 and a standard deviation of 2,400 a. what is the probability of getting more than 12,000 hits? b. what is the probability of getting fewer than 9,000 hits?
Akshay Reply
Bhartdarshan'is an internet-based travel agency wherein customer can see videos of the cities they plan to visit. The number of hits daily is a normally distributed random variable with a mean of 10,000 and a standard deviation of 2,400. a. What is the probability of getting more than 12,000 hits
Akshay
1
Bright
Sorry i want to learn more about this question
Bright
Someone help
Bright
a= 0.20233 b=0.3384
Sufiyan
a
Shaynaynay
How do I interpret level of significance?
Mohd Reply
It depends on your business problem or in Machine Learning you could use ROC- AUC cruve to decide the threshold value
Shivam
how skewness and kurtosis are used in statistics
Owen Reply
yes what is it
Taneeya
Got questions? Join the online conversation and get instant answers!
Jobilize.com Reply
Practice Key Terms 8

Get Jobilize Job Search Mobile App in your pocket Now!

Get it on Google Play Download on the App Store Now


Source:  OpenStax, College physics. OpenStax CNX. Jul 27, 2015 Download for free at http://legacy.cnx.org/content/col11406/1.9
Google Play and the Google Play logo are trademarks of Google Inc.

Notification Switch

Would you like to follow the 'College physics' conversation and receive update notifications?

Ask