<< Chapter < Page Chapter >> Page >
  • Explain standing waves.
  • Describe the mathematical representation of overtones and beat frequency.
Water surface of a river is shown, with mountains in the background. There are small ripples over the water surface.
These waves result from the superposition of several waves from different sources, producing a complex pattern. (credit: waterborough, Wikimedia Commons)

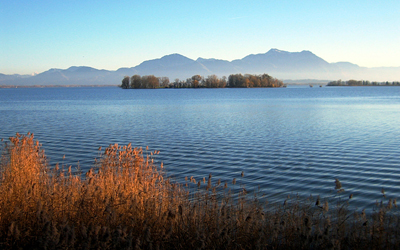
Most waves do not look very simple. They look more like the waves in [link] than like the simple water wave considered in Waves . (Simple waves may be created by a simple harmonic oscillation, and thus have a sinusoidal shape). Complex waves are more interesting, even beautiful, but they look formidable. Most waves appear complex because they result from several simple waves adding together. Luckily, the rules for adding waves are quite simple.

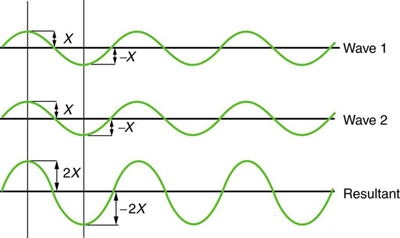
When two or more waves arrive at the same point, they superimpose themselves on one another. More specifically, the disturbances of waves are superimposed when they come together—a phenomenon called superposition    . Each disturbance corresponds to a force, and forces add. If the disturbances are along the same line, then the resulting wave is a simple addition of the disturbances of the individual waves—that is, their amplitudes add. [link] and [link] illustrate superposition in two special cases, both of which produce simple results.

[link] shows two identical waves that arrive at the same point exactly in phase. The crests of the two waves are precisely aligned, as are the troughs. This superposition produces pure constructive interference    . Because the disturbances add, pure constructive interference produces a wave that has twice the amplitude of the individual waves, but has the same wavelength.

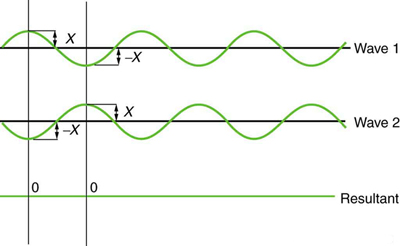
[link] shows two identical waves that arrive exactly out of phase—that is, precisely aligned crest to trough—producing pure destructive interference    . Because the disturbances are in the opposite direction for this superposition, the resulting amplitude is zero for pure destructive interference—the waves completely cancel.

The graph shows two identical waves that arrive at the same point exactly in phase. The crests of the two waves are precisely aligned, as are the troughs. The amplitude of each wave being X . It produces pure constructive wave. The disturbances add resulting in a new wave with twice the amplitude of the individual waves that is two X but of same wavelength.
Pure constructive interference of two identical waves produces one with twice the amplitude, but the same wavelength.
The graph shows two identical waves that arrive exactly out of phase. The crests of one wave are aligned with the trough of another wave. Each wave has amplitude equal to X. As the disturbances are in the opposite directions, they cancel out each other, resulting in zero amplitude which is shown as the third figure showing a green straight line, that is, the waves cancel each other producing pure destructive interference.
Pure destructive interference of two identical waves produces zero amplitude, or complete cancellation.

While pure constructive and pure destructive interference do occur, they require precisely aligned identical waves. The superposition of most waves produces a combination of constructive and destructive interference and can vary from place to place and time to time. Sound from a stereo, for example, can be loud in one spot and quiet in another. Varying loudness means the sound waves add partially constructively and partially destructively at different locations. A stereo has at least two speakers creating sound waves, and waves can reflect from walls. All these waves superimpose. An example of sounds that vary over time from constructive to destructive is found in the combined whine of airplane jets heard by a stationary passenger. The combined sound can fluctuate up and down in volume as the sound from the two engines varies in time from constructive to destructive. These examples are of waves that are similar.

Questions & Answers

how do you get the 2/50
Abba Reply
number of sport play by 50 student construct discrete data
Aminu Reply
width of the frangebany leaves on how to write a introduction
Theresa Reply
Solve the mean of variance
Veronica Reply
Step 1: Find the mean. To find the mean, add up all the scores, then divide them by the number of scores. ... Step 2: Find each score's deviation from the mean. ... Step 3: Square each deviation from the mean. ... Step 4: Find the sum of squares. ... Step 5: Divide the sum of squares by n – 1 or N.
kenneth
what is error
Yakuba Reply
Is mistake done to something
Vutshila
Hy
anas
hy
What is the life teble
anas
hy
Jibrin
statistics is the analyzing of data
Tajudeen Reply
what is statics?
Zelalem Reply
how do you calculate mean
Gloria Reply
diveving the sum if all values
Shaynaynay
let A1,A2 and A3 events be independent,show that (A1)^c, (A2)^c and (A3)^c are independent?
Fisaye Reply
what is statistics
Akhisani Reply
data collected all over the world
Shaynaynay
construct a less than and more than table
Imad Reply
The sample of 16 students is taken. The average age in the sample was 22 years with astandard deviation of 6 years. Construct a 95% confidence interval for the age of the population.
Aschalew Reply
Bhartdarshan' is an internet-based travel agency wherein customer can see videos of the cities they plant to visit. The number of hits daily is a normally distributed random variable with a mean of 10,000 and a standard deviation of 2,400 a. what is the probability of getting more than 12,000 hits? b. what is the probability of getting fewer than 9,000 hits?
Akshay Reply
Bhartdarshan'is an internet-based travel agency wherein customer can see videos of the cities they plan to visit. The number of hits daily is a normally distributed random variable with a mean of 10,000 and a standard deviation of 2,400. a. What is the probability of getting more than 12,000 hits
Akshay
1
Bright
Sorry i want to learn more about this question
Bright
Someone help
Bright
a= 0.20233 b=0.3384
Sufiyan
a
Shaynaynay
How do I interpret level of significance?
Mohd Reply
It depends on your business problem or in Machine Learning you could use ROC- AUC cruve to decide the threshold value
Shivam
how skewness and kurtosis are used in statistics
Owen Reply
yes what is it
Taneeya
Got questions? Join the online conversation and get instant answers!
Jobilize.com Reply
Practice Key Terms 8

Get Jobilize Job Search Mobile App in your pocket Now!

Get it on Google Play Download on the App Store Now


Source:  OpenStax, College physics. OpenStax CNX. Jul 27, 2015 Download for free at http://legacy.cnx.org/content/col11406/1.9
Google Play and the Google Play logo are trademarks of Google Inc.

Notification Switch

Would you like to follow the 'College physics' conversation and receive update notifications?

Ask