<< Chapter < Page Chapter >> Page >
  • Discuss heat transfer by radiation.
  • Explain the power of different materials.

You can feel the heat transfer from a fire and from the Sun. Similarly, you can sometimes tell that the oven is hot without touching its door or looking inside—it may just warm you as you walk by. The space between the Earth and the Sun is largely empty, without any possibility of heat transfer by convection or conduction. In these examples, heat is transferred by radiation. That is, the hot body emits electromagnetic waves that are absorbed by our skin: no medium is required for electromagnetic waves to propagate. Different names are used for electromagnetic waves of different wavelengths: radio waves, microwaves, infrared radiation    , visible light, ultraviolet radiation, X-rays, and gamma rays.

The figure shows a campfire. Some small logs are burning and the flames above them are visible against a dark background.
Most of the heat transfer from this fire to the observers is through infrared radiation. The visible light, although dramatic, transfers relatively little thermal energy. Convection transfers energy away from the observers as hot air rises, while conduction is negligibly slow here. Skin is very sensitive to infrared radiation, so that you can sense the presence of a fire without looking at it directly. (credit: Daniel X. O’Neil)

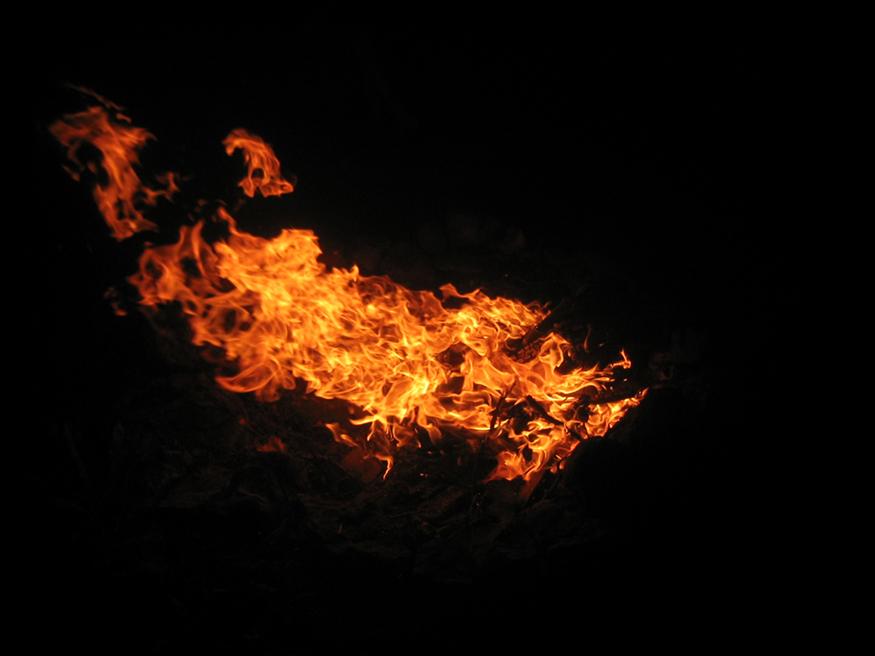
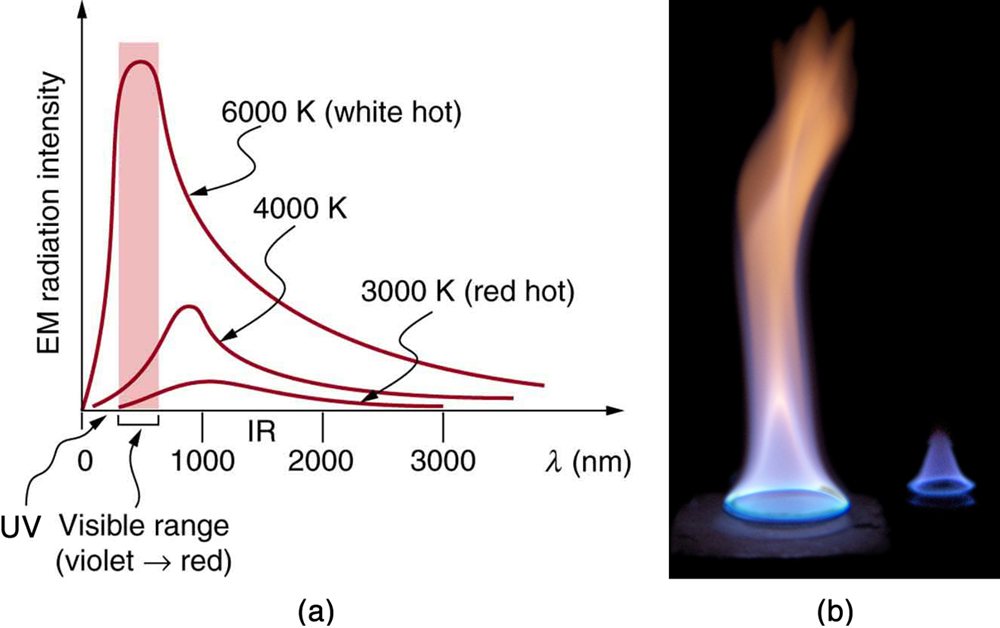
The energy of electromagnetic radiation depends on the wavelength (color) and varies over a wide range: a smaller wavelength (or higher frequency) corresponds to a higher energy. Because more heat is radiated at higher temperatures, a temperature change is accompanied by a color change. Take, for example, an electrical element on a stove, which glows from red to orange, while the higher-temperature steel in a blast furnace glows from yellow to white. The radiation you feel is mostly infrared, which corresponds to a lower temperature than that of the electrical element and the steel. The radiated energy depends on its intensity, which is represented in the figure below by the height of the distribution.

Electromagnetic Waves explains more about the electromagnetic spectrum and Introduction to Quantum Physics discusses how the decrease in wavelength corresponds to an increase in energy.

Figure a shows a graph of the intensity of electromagnetic radiation versus wavelength in nano meters. There are three curves on the graph labeled, from top to bottom, six thousand K, four thousand K, and three thousand K. The top curve peaks sharply at the beginning near about five hundred nano meters in what is labeled the visible range (violet to red). After the peak, this curve decays strongly by three thousand nano meters. The middle curve peaks more softly near nine hundred nano meters at a height about one third that of the first curve, and decays by three thousand nano meters. The lowest curve peaks very softly near one thousand nano meters curve and decreases slowly for higher wavelengths. The region between one thousand to two thousand nano meters is labeled the infrared range. Figure b shows two burners of a gas stove. One burner is closer and the other is in the background. The flame of the near burner is blue at the bottom and gradually changes to orange as you approach the top of the flame. The flame of the background burner is smaller and is essentially completely blue.
(a) A graph of the spectra of electromagnetic waves emitted from an ideal radiator at three different temperatures. The intensity or rate of radiation emission increases dramatically with temperature, and the spectrum shifts toward the visible and ultraviolet parts of the spectrum. The shaded portion denotes the visible part of the spectrum. It is apparent that the shift toward the ultraviolet with temperature makes the visible appearance shift from red to white to blue as temperature increases. (b) Note the variations in color corresponding to variations in flame temperature. (credit: Tuohirulla)

All objects absorb and emit electromagnetic radiation. The rate of heat transfer by radiation is largely determined by the color of the object. Black is the most effective, and white is the least effective. People living in hot climates generally avoid wearing black clothing, for instance (see [link] ). Similarly, black asphalt in a parking lot will be hotter than adjacent gray sidewalk on a summer day, because black absorbs better than gray. The reverse is also true—black radiates better than gray. Thus, on a clear summer night, the asphalt will be colder than the gray sidewalk, because black radiates the energy more rapidly than gray. An ideal radiator is the same color as an ideal absorber , and captures all the radiation that falls on it. In contrast, white is a poor absorber and is also a poor radiator. A white object reflects all radiation, like a mirror. (A perfect, polished white surface is mirror-like in appearance, and a crushed mirror looks white.)

Questions & Answers

differentiate between demand and supply giving examples
Lambiv Reply
differentiated between demand and supply using examples
Lambiv
what is labour ?
Lambiv
how will I do?
Venny Reply
how is the graph works?I don't fully understand
Rezat Reply
information
Eliyee
devaluation
Eliyee
t
WARKISA
hi guys good evening to all
Lambiv
multiple choice question
Aster Reply
appreciation
Eliyee
explain perfect market
Lindiwe Reply
In economics, a perfect market refers to a theoretical construct where all participants have perfect information, goods are homogenous, there are no barriers to entry or exit, and prices are determined solely by supply and demand. It's an idealized model used for analysis,
Ezea
What is ceteris paribus?
Shukri Reply
other things being equal
AI-Robot
When MP₁ becomes negative, TP start to decline. Extuples Suppose that the short-run production function of certain cut-flower firm is given by: Q=4KL-0.6K2 - 0.112 • Where is quantity of cut flower produced, I is labour input and K is fixed capital input (K-5). Determine the average product of lab
Kelo
Extuples Suppose that the short-run production function of certain cut-flower firm is given by: Q=4KL-0.6K2 - 0.112 • Where is quantity of cut flower produced, I is labour input and K is fixed capital input (K-5). Determine the average product of labour (APL) and marginal product of labour (MPL)
Kelo
yes,thank you
Shukri
Can I ask you other question?
Shukri
what is monopoly mean?
Habtamu Reply
What is different between quantity demand and demand?
Shukri Reply
Quantity demanded refers to the specific amount of a good or service that consumers are willing and able to purchase at a give price and within a specific time period. Demand, on the other hand, is a broader concept that encompasses the entire relationship between price and quantity demanded
Ezea
ok
Shukri
how do you save a country economic situation when it's falling apart
Lilia Reply
what is the difference between economic growth and development
Fiker Reply
Economic growth as an increase in the production and consumption of goods and services within an economy.but Economic development as a broader concept that encompasses not only economic growth but also social & human well being.
Shukri
production function means
Jabir
What do you think is more important to focus on when considering inequality ?
Abdisa Reply
any question about economics?
Awais Reply
sir...I just want to ask one question... Define the term contract curve? if you are free please help me to find this answer 🙏
Asui
it is a curve that we get after connecting the pareto optimal combinations of two consumers after their mutually beneficial trade offs
Awais
thank you so much 👍 sir
Asui
In economics, the contract curve refers to the set of points in an Edgeworth box diagram where both parties involved in a trade cannot be made better off without making one of them worse off. It represents the Pareto efficient allocations of goods between two individuals or entities, where neither p
Cornelius
In economics, the contract curve refers to the set of points in an Edgeworth box diagram where both parties involved in a trade cannot be made better off without making one of them worse off. It represents the Pareto efficient allocations of goods between two individuals or entities,
Cornelius
Suppose a consumer consuming two commodities X and Y has The following utility function u=X0.4 Y0.6. If the price of the X and Y are 2 and 3 respectively and income Constraint is birr 50. A,Calculate quantities of x and y which maximize utility. B,Calculate value of Lagrange multiplier. C,Calculate quantities of X and Y consumed with a given price. D,alculate optimum level of output .
Feyisa Reply
Answer
Feyisa
c
Jabir
the market for lemon has 10 potential consumers, each having an individual demand curve p=101-10Qi, where p is price in dollar's per cup and Qi is the number of cups demanded per week by the i th consumer.Find the market demand curve using algebra. Draw an individual demand curve and the market dema
Gsbwnw Reply
suppose the production function is given by ( L, K)=L¼K¾.assuming capital is fixed find APL and MPL. consider the following short run production function:Q=6L²-0.4L³ a) find the value of L that maximizes output b)find the value of L that maximizes marginal product
Abdureman
types of unemployment
Yomi Reply
What is the difference between perfect competition and monopolistic competition?
Mohammed
Got questions? Join the online conversation and get instant answers!
Jobilize.com Reply
Practice Key Terms 5

Get Jobilize Job Search Mobile App in your pocket Now!

Get it on Google Play Download on the App Store Now


Source:  OpenStax, College physics. OpenStax CNX. Jul 27, 2015 Download for free at http://legacy.cnx.org/content/col11406/1.9
Google Play and the Google Play logo are trademarks of Google Inc.

Notification Switch

Would you like to follow the 'College physics' conversation and receive update notifications?

Ask