<< Chapter < Page Chapter >> Page >

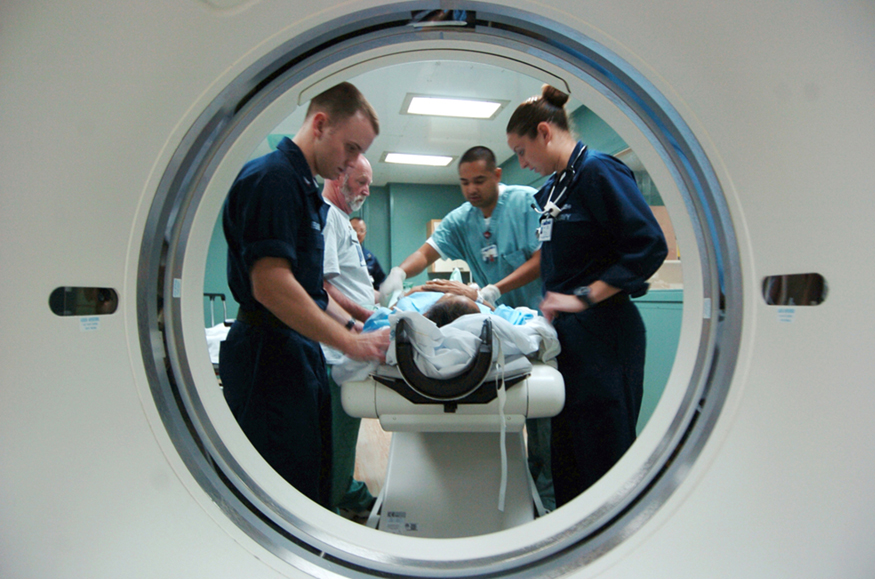
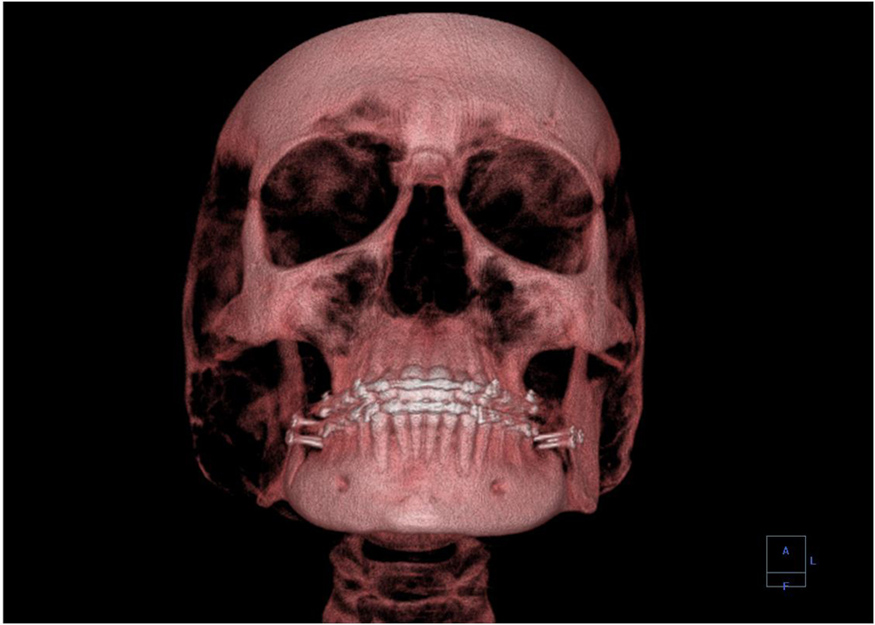
A standard x ray gives only a two-dimensional view of the object. Dense bones might hide images of soft tissue or organs. If you took another x ray from the side of the person (the first one being from the front), you would gain additional information. While shadow images are sufficient in many applications, far more sophisticated images can be produced with modern technology. [link] shows the use of a computed tomography (CT) scanner, also called computed axial tomography (CAT) scanner. X rays are passed through a narrow section (called a slice) of the patient’s body (or body part) over a range of directions. An array of many detectors on the other side of the patient registers the x rays. The system is then rotated around the patient and another image is taken, and so on. The x-ray tube and detector array are mechanically attached and so rotate together. Complex computer image processing of the relative absorption of the x rays along different directions produces a highly-detailed image. Different slices are taken as the patient moves through the scanner on a table. Multiple images of different slices can also be computer analyzed to produce three-dimensional information, sometimes enhancing specific types of tissue, as shown in [link] . G. Hounsfield (UK) and A. Cormack (US) won the Nobel Prize in Medicine in 1979 for their development of computed tomography.

A photographic image taken through the port of a C T scanner, showing a patient on a stretcher surrounded by three nursing staff and a doctor who are taking the patient’s C T scan.
A patient being positioned in a CT scanner aboard the hospital ship USNS Mercy. The CT scanner passes x rays through slices of the patient’s body (or body part) over a range of directions. The relative absorption of the x rays along different directions is computer analyzed to produce highly detailed images. Three-dimensional information can be obtained from multiple slices. (credit: Rebecca Moat, U.S. Navy)
A 3-D image showing a human skull from the front.
This three-dimensional image of a skull was produced by computed tomography, involving analysis of several x-ray slices of the head. (credit: Emailshankar, Wikimedia Commons)

X-ray diffraction and crystallography

Since x-ray photons are very energetic, they have relatively short wavelengths. For example, the 54.4-keV K α size 12{K rSub { size 8{α} } } {} x ray of [link] has a wavelength λ = hc / E = 0 . 0228 nm size 12{λ= ital "hc"/E=0 "." "0230"`"nm"} {} . Thus, typical x-ray photons act like rays when they encounter macroscopic objects, like teeth, and produce sharp shadows; however, since atoms are on the order of 0.1 nm in size, x rays can be used to detect the location, shape, and size of atoms and molecules. The process is called x-ray diffraction    , because it involves the diffraction and interference of x rays to produce patterns that can be analyzed for information about the structures that scattered the x rays. Perhaps the most famous example of x-ray diffraction is the discovery of the double-helix structure of DNA in 1953 by an international team of scientists working at the Cavendish Laboratory—American James Watson, Englishman Francis Crick, and New Zealand–born Maurice Wilkins. Using x-ray diffraction data produced by Rosalind Franklin, they were the first to discern the structure of DNA that is so crucial to life. For this, Watson, Crick, and Wilkins were awarded the 1962 Nobel Prize in Physiology or Medicine. There is much debate and controversy over the issue that Rosalind Franklin was not included in the prize.

Questions & Answers

how do you get the 2/50
Abba Reply
number of sport play by 50 student construct discrete data
Aminu Reply
width of the frangebany leaves on how to write a introduction
Theresa Reply
Solve the mean of variance
Veronica Reply
Step 1: Find the mean. To find the mean, add up all the scores, then divide them by the number of scores. ... Step 2: Find each score's deviation from the mean. ... Step 3: Square each deviation from the mean. ... Step 4: Find the sum of squares. ... Step 5: Divide the sum of squares by n – 1 or N.
kenneth
what is error
Yakuba Reply
Is mistake done to something
Vutshila
Hy
anas
hy
What is the life teble
anas
hy
Jibrin
statistics is the analyzing of data
Tajudeen Reply
what is statics?
Zelalem Reply
how do you calculate mean
Gloria Reply
diveving the sum if all values
Shaynaynay
let A1,A2 and A3 events be independent,show that (A1)^c, (A2)^c and (A3)^c are independent?
Fisaye Reply
what is statistics
Akhisani Reply
data collected all over the world
Shaynaynay
construct a less than and more than table
Imad Reply
The sample of 16 students is taken. The average age in the sample was 22 years with astandard deviation of 6 years. Construct a 95% confidence interval for the age of the population.
Aschalew Reply
Bhartdarshan' is an internet-based travel agency wherein customer can see videos of the cities they plant to visit. The number of hits daily is a normally distributed random variable with a mean of 10,000 and a standard deviation of 2,400 a. what is the probability of getting more than 12,000 hits? b. what is the probability of getting fewer than 9,000 hits?
Akshay Reply
Bhartdarshan'is an internet-based travel agency wherein customer can see videos of the cities they plan to visit. The number of hits daily is a normally distributed random variable with a mean of 10,000 and a standard deviation of 2,400. a. What is the probability of getting more than 12,000 hits
Akshay
1
Bright
Sorry i want to learn more about this question
Bright
Someone help
Bright
a= 0.20233 b=0.3384
Sufiyan
a
Shaynaynay
How do I interpret level of significance?
Mohd Reply
It depends on your business problem or in Machine Learning you could use ROC- AUC cruve to decide the threshold value
Shivam
how skewness and kurtosis are used in statistics
Owen Reply
yes what is it
Taneeya
Got questions? Join the online conversation and get instant answers!
Jobilize.com Reply
Practice Key Terms 2

Get Jobilize Job Search Mobile App in your pocket Now!

Get it on Google Play Download on the App Store Now


Source:  OpenStax, College physics for ap® courses. OpenStax CNX. Nov 04, 2016 Download for free at https://legacy.cnx.org/content/col11844/1.14
Google Play and the Google Play logo are trademarks of Google Inc.

Notification Switch

Would you like to follow the 'College physics for ap® courses' conversation and receive update notifications?

Ask