<< Chapter < Page Chapter >> Page >
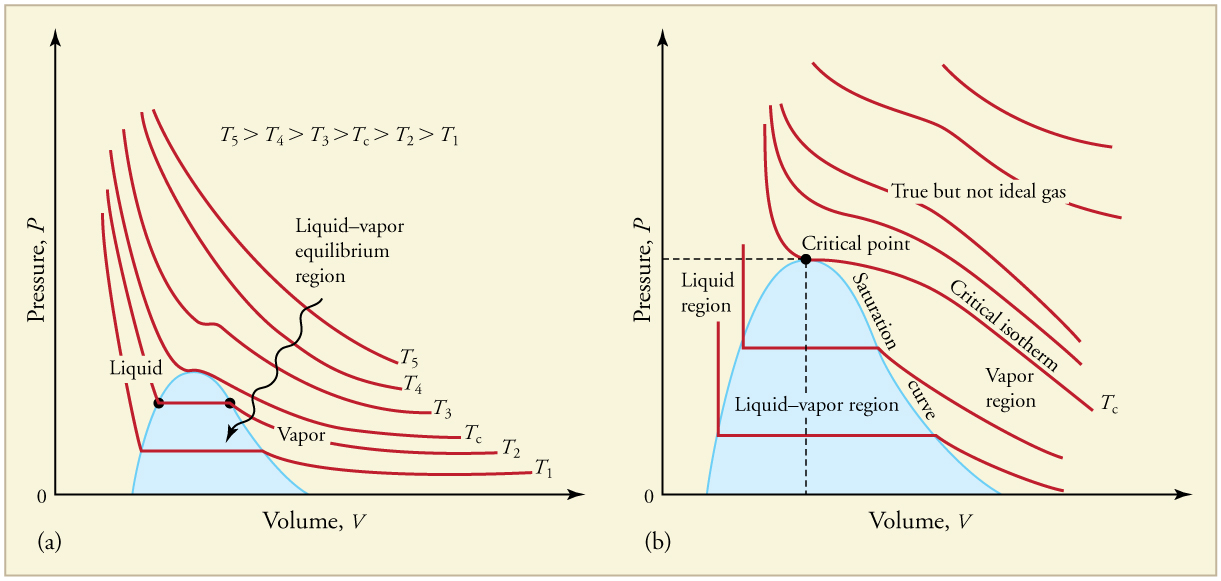
Graphs of pressure versus volume at six different temperatures, T one through T five and T critical. T one is the lowest temperature and T five is the highest. T critical is in the middle. Graphs show that pressure per unit volume is greater for greater temperatures. Pressure decreases with increasing volume for all temperatures, except at low temperatures when pressure is constant with increasing volume during a phase change.
PV size 12{ ital "PV"} {} diagrams. (a) Each curve (isotherm) represents the relationship between P size 12{P} {} and V size 12{V} {} at a fixed temperature; the upper curves are at higher temperatures. The lower curves are not hyperbolas, because the gas is no longer an ideal gas. (b) An expanded portion of the PV size 12{ ital "PV"} {} diagram for low temperatures, where the phase can change from a gas to a liquid. The term “vapor” refers to the gas phase when it exists at a temperature below the boiling temperature.
Critical temperatures and pressures
Substance Critical temperature Critical pressure
K size 12{K} {} º C size 12{°C} {} Pa size 12{"Pa"} {} atm size 12{"atm"} {}
Water 647.4 374.3 22 . 12 × 10 6 size 12{"22" "." "12"×"10" rSup { size 8{6} } } {} 219.0
Sulfur dioxide 430.7 157.6 7 . 88 × 10 6 size 12{7 "." "88" times "10" rSup { size 8{6} } } {} 78.0
Ammonia 405.5 132.4 11 . 28 × 10 6 size 12{"11" "." "28"×"10" rSup { size 8{6} } } {} 111.7
Carbon dioxide 304.2 31.1 7 . 39 × 10 6 size 12{7 "." "39"×"10" rSup { size 8{6} } } {} 73.2
Oxygen 154.8 −118.4 5 . 08 × 10 6 size 12{5 "." "08"×"10" rSup { size 8{6} } } {} 50.3
Nitrogen 126.2 −146.9 3 . 39 × 10 6 size 12{3 "." "39"×"10" rSup { size 8{6} } } {} 33.6
Hydrogen 33.3 −239.9 1 . 30 × 10 6 size 12{1 "." "30"×"10" rSup { size 8{6} } } {} 12.9
Helium 5.3 −267.9 0 . 229 × 10 6 size 12{0 "." "229" times "10" rSup { size 8{6} } } {} 2.27

Phase diagrams

The plots of pressure versus temperatures provide considerable insight into thermal properties of substances. There are well-defined regions on these graphs that correspond to various phases of matter, so PT size 12{ ital "PT"} {} graphs are called phase diagrams . [link] shows the phase diagram for water. Using the graph, if you know the pressure and temperature you can determine the phase of water. The solid lines—boundaries between phases—indicate temperatures and pressures at which the phases coexist (that is, they exist together in ratios, depending on pressure and temperature). For example, the boiling point of water is 100 º C size 12{"100"°C} {} at 1.00 atm. As the pressure increases, the boiling temperature rises steadily to 374 º C size 12{"374"°C} {} at a pressure of 218 atm. A pressure cooker (or even a covered pot) will cook food faster because the water can exist as a liquid at temperatures greater than 100 º C size 12{"100"°C} {} without all boiling away. The curve ends at a point called the critical point , because at higher temperatures the liquid phase does not exist at any pressure. The critical point occurs at the critical temperature, as you can see for water from [link] . The critical temperature for oxygen is 118 º C size 12{ +- "118"°C} {} , so oxygen cannot be liquefied above this temperature.
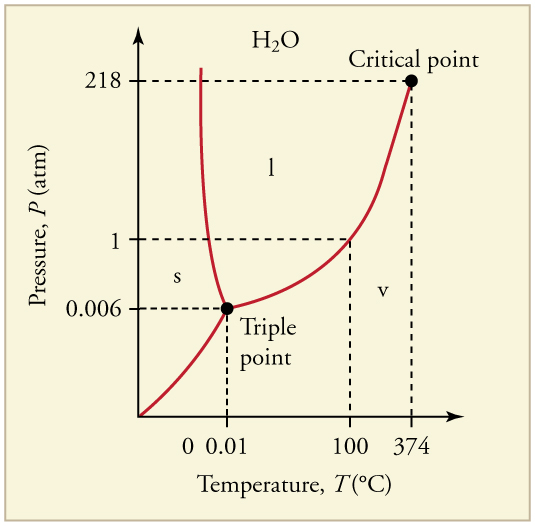
Graph of pressure versus temperature showing the boundaries of the three phases of water, along with the triple point and critical point. The triple point, where all three phases exist, is at 0 point 006 atmospheres and 0 point 01 degrees C. The critical point is at two hundred eighteen atmospheres and three hundred seventy four degrees C. Solid water is in the P T region generally to the left (lower temperature, lower or higher pressure, from the triple point). Liquid water is generally above and to the right of the triple point (higher pressure, higher temperature). The region of water vapor is to the lower right of the triple point (lower pressure and temperature to higher temperature and pressure).
The phase diagram ( PT size 12{ ital "PT"} {} graph) for water. Note that the axes are nonlinear and the graph is not to scale. This graph is simplified—there are several other exotic phases of ice at higher pressures.

Similarly, the curve between the solid and liquid regions in [link] gives the melting temperature at various pressures. For example, the melting point is 0 º C size 12{0°C} {} at 1.00 atm, as expected. Note that, at a fixed temperature, you can change the phase from solid (ice) to liquid (water) by increasing the pressure. Ice melts from pressure in the hands of a snowball maker. From the phase diagram, we can also say that the melting temperature of ice rises with increased pressure. When a car is driven over snow, the increased pressure from the tires melts the snowflakes; afterwards the water refreezes and forms an ice layer.

At sufficiently low pressures there is no liquid phase, but the substance can exist as either gas or solid. For water, there is no liquid phase at pressures below 0.00600 atm. The phase change from solid to gas is called sublimation    . It accounts for large losses of snow pack that never make it into a river, the routine automatic defrosting of a freezer, and the freeze-drying process applied to many foods. Carbon dioxide, on the other hand, sublimates at standard atmospheric pressure of 1 atm. (The solid form of CO 2 size 12{"CO" rSub { size 8{2} } } {} is known as dry ice because it does not melt. Instead, it moves directly from the solid to the gas state.)

Questions & Answers

how do you get the 2/50
Abba Reply
number of sport play by 50 student construct discrete data
Aminu Reply
width of the frangebany leaves on how to write a introduction
Theresa Reply
Solve the mean of variance
Veronica Reply
Step 1: Find the mean. To find the mean, add up all the scores, then divide them by the number of scores. ... Step 2: Find each score's deviation from the mean. ... Step 3: Square each deviation from the mean. ... Step 4: Find the sum of squares. ... Step 5: Divide the sum of squares by n – 1 or N.
kenneth
what is error
Yakuba Reply
Is mistake done to something
Vutshila
Hy
anas
hy
What is the life teble
anas
hy
Jibrin
statistics is the analyzing of data
Tajudeen Reply
what is statics?
Zelalem Reply
how do you calculate mean
Gloria Reply
diveving the sum if all values
Shaynaynay
let A1,A2 and A3 events be independent,show that (A1)^c, (A2)^c and (A3)^c are independent?
Fisaye Reply
what is statistics
Akhisani Reply
data collected all over the world
Shaynaynay
construct a less than and more than table
Imad Reply
The sample of 16 students is taken. The average age in the sample was 22 years with astandard deviation of 6 years. Construct a 95% confidence interval for the age of the population.
Aschalew Reply
Bhartdarshan' is an internet-based travel agency wherein customer can see videos of the cities they plant to visit. The number of hits daily is a normally distributed random variable with a mean of 10,000 and a standard deviation of 2,400 a. what is the probability of getting more than 12,000 hits? b. what is the probability of getting fewer than 9,000 hits?
Akshay Reply
Bhartdarshan'is an internet-based travel agency wherein customer can see videos of the cities they plan to visit. The number of hits daily is a normally distributed random variable with a mean of 10,000 and a standard deviation of 2,400. a. What is the probability of getting more than 12,000 hits
Akshay
1
Bright
Sorry i want to learn more about this question
Bright
Someone help
Bright
a= 0.20233 b=0.3384
Sufiyan
a
Shaynaynay
How do I interpret level of significance?
Mohd Reply
It depends on your business problem or in Machine Learning you could use ROC- AUC cruve to decide the threshold value
Shivam
how skewness and kurtosis are used in statistics
Owen Reply
yes what is it
Taneeya
Got questions? Join the online conversation and get instant answers!
Jobilize.com Reply

Get Jobilize Job Search Mobile App in your pocket Now!

Get it on Google Play Download on the App Store Now


Source:  OpenStax, College physics for ap® courses. OpenStax CNX. Nov 04, 2016 Download for free at https://legacy.cnx.org/content/col11844/1.14
Google Play and the Google Play logo are trademarks of Google Inc.

Notification Switch

Would you like to follow the 'College physics for ap® courses' conversation and receive update notifications?

Ask