<< Chapter < Page Chapter >> Page >

Learning objectives

By the end of this section, you will be able to:

  • Understand the rules of vector addition, subtraction, and multiplication.
  • Apply graphical methods of vector addition and subtraction to determine the displacement of moving objects.

The information presented in this section supports the following AP® learning objectives and science practices:

  • 3.A.1.1 The student is able to express the motion of an object using narrative, mathematical, and graphical representations. (S.P. 1.5, 2.1, 2.2)
  • 3.A.1.3 The student is able to analyze experimental data describing the motion of an object and is able to express the results of the analysis using narrative, mathematical, and graphical representations. (S.P. 5.1)
Some Hawaiian Islands like Kauai Oahu, Molokai, Lanai, Maui, Kahoolawe, and Hawaii are shown. On the scale map of Hawaiian Islands the path of a journey is shown moving from Hawaii to Molokai. The path of the journey is turning at different angles and finally reaching its destination. The displacement of the journey is shown with the help of a straight line connecting its starting point and the destination.
Displacement can be determined graphically using a scale map, such as this one of the Hawaiian Islands. A journey from Hawai'i to Moloka'i has a number of legs, or journey segments. These segments can be added graphically with a ruler to determine the total two-dimensional displacement of the journey. (credit: US Geological Survey)

Vectors in two dimensions

A vector    is a quantity that has magnitude and direction. Displacement, velocity, acceleration, and force, for example, are all vectors. In one-dimensional, or straight-line, motion, the direction of a vector can be given simply by a plus or minus sign. In two dimensions (2-d), however, we specify the direction of a vector relative to some reference frame (i.e., coordinate system), using an arrow having length proportional to the vector's magnitude and pointing in the direction of the vector.

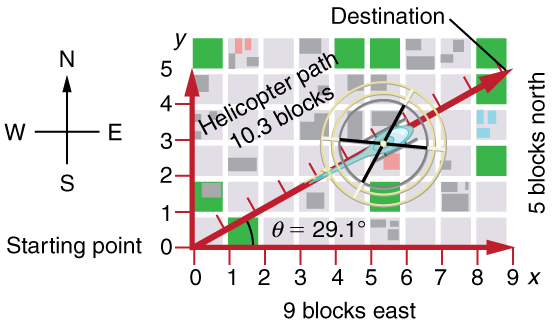
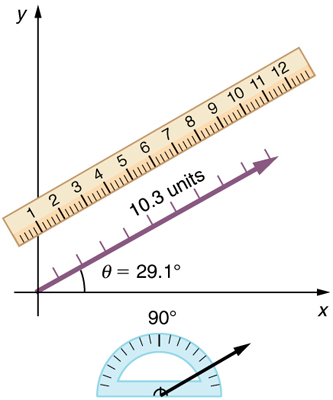
[link] shows such a graphical representation of a vector , using as an example the total displacement for the person walking in a city considered in Kinematics in Two Dimensions: An Introduction . We shall use the notation that a boldface symbol, such as D size 12{D} {} , stands for a vector. Its magnitude is represented by the symbol in italics, D size 12{D} {} , and its direction by θ size 12{θ} {} .

Vectors in this text

In this text, we will represent a vector with a boldface variable. For example, we will represent the quantity force with the vector F size 12{F} {} , which has both magnitude and direction. The magnitude of the vector will be represented by a variable in italics, such as F size 12{F} {} , and the direction of the variable will be given by an angle θ size 12{θ} {} .

A graph is shown. On the axes the scale is set to one block is equal to one unit. A helicopter starts moving from the origin at an angle of twenty nine point one degrees above the x axis. The current position of the helicopter is ten point three blocks along its line of motion. The destination of the helicopter is the point which is nine blocks in the positive x direction and five blocks in the positive y direction. The positive direction of the x axis is east and the positive direction of the y axis is north.
A person walks 9 blocks east and 5 blocks north. The displacement is 10.3 blocks at an angle 29 .1° size 12{"29" "." "1°"} {} north of east.
On a graph a vector is shown. It is inclined at an angle theta equal to twenty nine point one degrees above the positive x axis. A protractor is shown to the right of the x axis to measure the angle. A ruler is also shown parallel to the vector to measure its length. The ruler shows that the length of the vector is ten point three units.
To describe the resultant vector for the person walking in a city considered in [link] graphically, draw an arrow to represent the total displacement vector D size 12{D} {} . Using a protractor, draw a line at an angle θ size 12{θ} {} relative to the east-west axis. The length D size 12{D} {} of the arrow is proportional to the vector's magnitude and is measured along the line with a ruler. In this example, the magnitude D size 12{D} {} of the vector is 10.3 units, and the direction θ size 12{θ} {} is 29.1° size 12{"29" "." 1 rSup { size 12{°} } } {} north of east.

Vector addition: head-to-tail method

The head-to-tail method    is a graphical way to add vectors, described in [link] below and in the steps following. The tail    of the vector is the starting point of the vector, and the head (or tip) of a vector is the final, pointed end of the arrow.

Questions & Answers

differentiate between demand and supply giving examples
Lambiv Reply
differentiated between demand and supply using examples
Lambiv
what is labour ?
Lambiv
how will I do?
Venny Reply
how is the graph works?I don't fully understand
Rezat Reply
information
Eliyee
devaluation
Eliyee
t
WARKISA
hi guys good evening to all
Lambiv
multiple choice question
Aster Reply
appreciation
Eliyee
explain perfect market
Lindiwe Reply
In economics, a perfect market refers to a theoretical construct where all participants have perfect information, goods are homogenous, there are no barriers to entry or exit, and prices are determined solely by supply and demand. It's an idealized model used for analysis,
Ezea
What is ceteris paribus?
Shukri Reply
other things being equal
AI-Robot
When MP₁ becomes negative, TP start to decline. Extuples Suppose that the short-run production function of certain cut-flower firm is given by: Q=4KL-0.6K2 - 0.112 • Where is quantity of cut flower produced, I is labour input and K is fixed capital input (K-5). Determine the average product of lab
Kelo
Extuples Suppose that the short-run production function of certain cut-flower firm is given by: Q=4KL-0.6K2 - 0.112 • Where is quantity of cut flower produced, I is labour input and K is fixed capital input (K-5). Determine the average product of labour (APL) and marginal product of labour (MPL)
Kelo
yes,thank you
Shukri
Can I ask you other question?
Shukri
what is monopoly mean?
Habtamu Reply
What is different between quantity demand and demand?
Shukri Reply
Quantity demanded refers to the specific amount of a good or service that consumers are willing and able to purchase at a give price and within a specific time period. Demand, on the other hand, is a broader concept that encompasses the entire relationship between price and quantity demanded
Ezea
ok
Shukri
how do you save a country economic situation when it's falling apart
Lilia Reply
what is the difference between economic growth and development
Fiker Reply
Economic growth as an increase in the production and consumption of goods and services within an economy.but Economic development as a broader concept that encompasses not only economic growth but also social & human well being.
Shukri
production function means
Jabir
What do you think is more important to focus on when considering inequality ?
Abdisa Reply
any question about economics?
Awais Reply
sir...I just want to ask one question... Define the term contract curve? if you are free please help me to find this answer 🙏
Asui
it is a curve that we get after connecting the pareto optimal combinations of two consumers after their mutually beneficial trade offs
Awais
thank you so much 👍 sir
Asui
In economics, the contract curve refers to the set of points in an Edgeworth box diagram where both parties involved in a trade cannot be made better off without making one of them worse off. It represents the Pareto efficient allocations of goods between two individuals or entities, where neither p
Cornelius
In economics, the contract curve refers to the set of points in an Edgeworth box diagram where both parties involved in a trade cannot be made better off without making one of them worse off. It represents the Pareto efficient allocations of goods between two individuals or entities,
Cornelius
Suppose a consumer consuming two commodities X and Y has The following utility function u=X0.4 Y0.6. If the price of the X and Y are 2 and 3 respectively and income Constraint is birr 50. A,Calculate quantities of x and y which maximize utility. B,Calculate value of Lagrange multiplier. C,Calculate quantities of X and Y consumed with a given price. D,alculate optimum level of output .
Feyisa Reply
Answer
Feyisa
c
Jabir
the market for lemon has 10 potential consumers, each having an individual demand curve p=101-10Qi, where p is price in dollar's per cup and Qi is the number of cups demanded per week by the i th consumer.Find the market demand curve using algebra. Draw an individual demand curve and the market dema
Gsbwnw Reply
suppose the production function is given by ( L, K)=L¼K¾.assuming capital is fixed find APL and MPL. consider the following short run production function:Q=6L²-0.4L³ a) find the value of L that maximizes output b)find the value of L that maximizes marginal product
Abdureman
types of unemployment
Yomi Reply
What is the difference between perfect competition and monopolistic competition?
Mohammed
Got questions? Join the online conversation and get instant answers!
Jobilize.com Reply

Get Jobilize Job Search Mobile App in your pocket Now!

Get it on Google Play Download on the App Store Now


Source:  OpenStax, College physics for ap® courses. OpenStax CNX. Nov 04, 2016 Download for free at https://legacy.cnx.org/content/col11844/1.14
Google Play and the Google Play logo are trademarks of Google Inc.

Notification Switch

Would you like to follow the 'College physics for ap® courses' conversation and receive update notifications?

Ask