<< Chapter < Page Chapter >> Page >

Learning objectives

By the end of this section, you will be able to:

  • Discuss the single slit diffraction pattern.

The information presented in this section supports the following AP® learning objectives and science practices:

  • 6.C.2.1 The student is able to make claims about the diffraction pattern produced when a wave passes through a small opening and to qualitatively apply the wave model to quantities that describe the generation of a diffraction pattern when a wave passes through an opening whose dimensions are comparable to the wavelength of the wave.

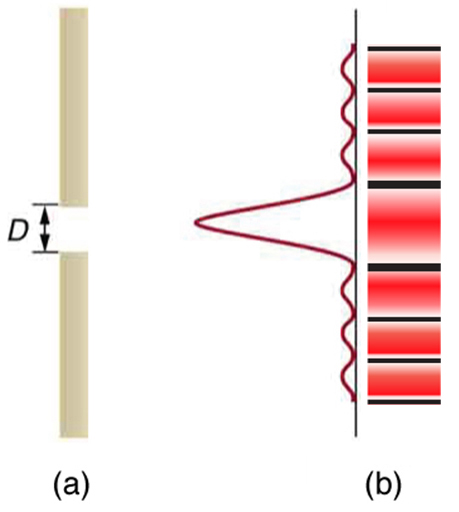
Light passing through a single slit forms a diffraction pattern somewhat different from those formed by double slits or diffraction gratings. [link] shows a single slit diffraction pattern. Note that the central maximum is larger than those on either side, and that the intensity decreases rapidly on either side. In contrast, a diffraction grating produces evenly spaced lines that dim slowly on either side of center.

Part a of the figure shows a slit in a vertical bar. To the right of the bar is a graph of intensity versus height. The graph is turned ninety degrees counterclockwise so that the intensity scale increases to the left and the height increases as you go up the page. Just in front of the gap, a strong central peak extends leftward from the graph’s baseline, and many smaller satellite peaks appear above and below this central peak. Part b of the figure shows a drawing of the two-dimensional intensity pattern that is observed from single slit diffraction. The central stripe is quite broad compared to the satellite stripes, and there are dark areas between all the stripes.
(a) Single slit diffraction pattern. Monochromatic light passing through a single slit has a central maximum and many smaller and dimmer maxima on either side. The central maximum is six times higher than shown. (b) The drawing shows the bright central maximum and dimmer and thinner maxima on either side.

The analysis of single slit diffraction is illustrated in [link] . Here we consider light coming from different parts of the same slit. According to Huygens’s principle, every part of the wavefront in the slit emits wavelets. These are like rays that start out in phase and head in all directions. (Each ray is perpendicular to the wavefront of a wavelet.) Assuming the screen is very far away compared with the size of the slit, rays heading toward a common destination are nearly parallel. When they travel straight ahead, as in [link] (a), they remain in phase, and a central maximum is obtained. However, when rays travel at an angle θ size 12{θ} {} relative to the original direction of the beam, each travels a different distance to a common location, and they can arrive in or out of phase. In [link] (b), the ray from the bottom travels a distance of one wavelength λ size 12{λ} {} farther than the ray from the top. Thus a ray from the center travels a distance λ / 2 size 12{λ/2} {} farther than the one on the left, arrives out of phase, and interferes destructively. A ray from slightly above the center and one from slightly above the bottom will also cancel one another. In fact, each ray from the slit will have another to interfere destructively, and a minimum in intensity will occur at this angle. There will be another minimum at the same angle to the right of the incident direction of the light.

The figure shows four schematics of a ray bundle passing through a single slit. The slit is represented as a gap in a vertical line. In the first schematic, the ray bundle passes horizontally through the slit. This schematic is labeled theta equals zero and bright. The second schematic is labeled dark and shows the ray bundle passing through the slit an angle of roughly fifteen degrees above the horizontal. The path length difference between the top and bottom ray is lambda, and the schematic is labeled sine theta equals lambda over d. The third schematic is labeled bright and shows the ray bundle passing through the slit at an angle of about twenty five degrees above the horizontal. The path length difference between the top and bottom rays is three lambda over two d, and the schematic is labeled sine theta equals three lambda over two d. The final schematic is labeled dark and shows the ray bundle passing through the slit at an angle of about forty degrees above the horizontal. The path length difference between the top and bottom rays is two lambda over d, and the schematic is labeled sine theta equals two lambda over d.
Light passing through a single slit is diffracted in all directions and may interfere constructively or destructively, depending on the angle. The difference in path length for rays from either side of the slit is seen to be D sin θ size 12{D`"sin"`θ} {} .

At the larger angle shown in [link] (c), the path lengths differ by / 2 size 12{3λ/2} {} for rays from the top and bottom of the slit. One ray travels a distance λ size 12{λ} {} different from the ray from the bottom and arrives in phase, interfering constructively. Two rays, each from slightly above those two, will also add constructively. Most rays from the slit will have another to interfere with constructively, and a maximum in intensity will occur at this angle. However, all rays do not interfere constructively for this situation, and so the maximum is not as intense as the central maximum. Finally, in [link] (d), the angle shown is large enough to produce a second minimum. As seen in the figure, the difference in path length for rays from either side of the slit is D sin θ size 12{D`"sin"θ} {} , and we see that a destructive minimum is obtained when this distance is an integral multiple of the wavelength.

Questions & Answers

differentiate between demand and supply giving examples
Lambiv Reply
differentiated between demand and supply using examples
Lambiv
what is labour ?
Lambiv
how will I do?
Venny Reply
how is the graph works?I don't fully understand
Rezat Reply
information
Eliyee
devaluation
Eliyee
t
WARKISA
hi guys good evening to all
Lambiv
multiple choice question
Aster Reply
appreciation
Eliyee
explain perfect market
Lindiwe Reply
In economics, a perfect market refers to a theoretical construct where all participants have perfect information, goods are homogenous, there are no barriers to entry or exit, and prices are determined solely by supply and demand. It's an idealized model used for analysis,
Ezea
What is ceteris paribus?
Shukri Reply
other things being equal
AI-Robot
When MP₁ becomes negative, TP start to decline. Extuples Suppose that the short-run production function of certain cut-flower firm is given by: Q=4KL-0.6K2 - 0.112 • Where is quantity of cut flower produced, I is labour input and K is fixed capital input (K-5). Determine the average product of lab
Kelo
Extuples Suppose that the short-run production function of certain cut-flower firm is given by: Q=4KL-0.6K2 - 0.112 • Where is quantity of cut flower produced, I is labour input and K is fixed capital input (K-5). Determine the average product of labour (APL) and marginal product of labour (MPL)
Kelo
yes,thank you
Shukri
Can I ask you other question?
Shukri
what is monopoly mean?
Habtamu Reply
What is different between quantity demand and demand?
Shukri Reply
Quantity demanded refers to the specific amount of a good or service that consumers are willing and able to purchase at a give price and within a specific time period. Demand, on the other hand, is a broader concept that encompasses the entire relationship between price and quantity demanded
Ezea
ok
Shukri
how do you save a country economic situation when it's falling apart
Lilia Reply
what is the difference between economic growth and development
Fiker Reply
Economic growth as an increase in the production and consumption of goods and services within an economy.but Economic development as a broader concept that encompasses not only economic growth but also social & human well being.
Shukri
production function means
Jabir
What do you think is more important to focus on when considering inequality ?
Abdisa Reply
any question about economics?
Awais Reply
sir...I just want to ask one question... Define the term contract curve? if you are free please help me to find this answer 🙏
Asui
it is a curve that we get after connecting the pareto optimal combinations of two consumers after their mutually beneficial trade offs
Awais
thank you so much 👍 sir
Asui
In economics, the contract curve refers to the set of points in an Edgeworth box diagram where both parties involved in a trade cannot be made better off without making one of them worse off. It represents the Pareto efficient allocations of goods between two individuals or entities, where neither p
Cornelius
In economics, the contract curve refers to the set of points in an Edgeworth box diagram where both parties involved in a trade cannot be made better off without making one of them worse off. It represents the Pareto efficient allocations of goods between two individuals or entities,
Cornelius
Suppose a consumer consuming two commodities X and Y has The following utility function u=X0.4 Y0.6. If the price of the X and Y are 2 and 3 respectively and income Constraint is birr 50. A,Calculate quantities of x and y which maximize utility. B,Calculate value of Lagrange multiplier. C,Calculate quantities of X and Y consumed with a given price. D,alculate optimum level of output .
Feyisa Reply
Answer
Feyisa
c
Jabir
the market for lemon has 10 potential consumers, each having an individual demand curve p=101-10Qi, where p is price in dollar's per cup and Qi is the number of cups demanded per week by the i th consumer.Find the market demand curve using algebra. Draw an individual demand curve and the market dema
Gsbwnw Reply
suppose the production function is given by ( L, K)=L¼K¾.assuming capital is fixed find APL and MPL. consider the following short run production function:Q=6L²-0.4L³ a) find the value of L that maximizes output b)find the value of L that maximizes marginal product
Abdureman
types of unemployment
Yomi Reply
What is the difference between perfect competition and monopolistic competition?
Mohammed
Got questions? Join the online conversation and get instant answers!
Jobilize.com Reply
Practice Key Terms 1

Get Jobilize Job Search Mobile App in your pocket Now!

Get it on Google Play Download on the App Store Now


Source:  OpenStax, College physics for ap® courses. OpenStax CNX. Nov 04, 2016 Download for free at https://legacy.cnx.org/content/col11844/1.14
Google Play and the Google Play logo are trademarks of Google Inc.

Notification Switch

Would you like to follow the 'College physics for ap® courses' conversation and receive update notifications?

Ask