<< Chapter < Page Chapter >> Page >

Learning objectives

By the end of this section, you will be able to:

  • Use both versions of Heisenberg’s uncertainty principle in calculations.
  • Explain the implications of Heisenberg’s uncertainty principle for measurements.

The information presented in this section supports the following AP® learning objectives and science practices:

  • 7.C.1.1 The student is able to use a graphical wave function representation of a particle to predict qualitatively the probability of finding a particle in a specific spatial region. (S.P. 1.4)

Probability distribution

Matter and photons are waves, implying they are spread out over some distance. What is the position of a particle, such as an electron? Is it at the center of the wave? The answer lies in how you measure the position of an electron. Experiments show that you will find the electron at some definite location, unlike a wave. But if you set up exactly the same situation and measure it again, you will find the electron in a different location, often far outside any experimental uncertainty in your measurement. Repeated measurements will display a statistical distribution of locations that appears wavelike. (See [link] .)

A graph is shown for intensity which is varying like a wave. Corresponding to the maximum point of the wave electrons are shown as small dots in three strips. These strips show different number of electrons with varying density of dots along the length of the strip. A larger number of electrons are in the first strip, a smaller number of electrons in the second strip, and very few electrons in third strip.
The building up of the diffraction pattern of electrons scattered from a crystal surface. Each electron arrives at a definite location, which cannot be precisely predicted. The overall distribution shown at the bottom can be predicted as the diffraction of waves having the de Broglie wavelength of the electrons.
A double-slit interference wavelength pattern for electrons is shown in figure a and for photons in figure b.
Double-slit interference for electrons (a) and photons (b) is identical for equal wavelengths and equal slit separations. Both patterns are probability distributions in the sense that they are built up by individual particles traversing the apparatus, the paths of which are not individually predictable.

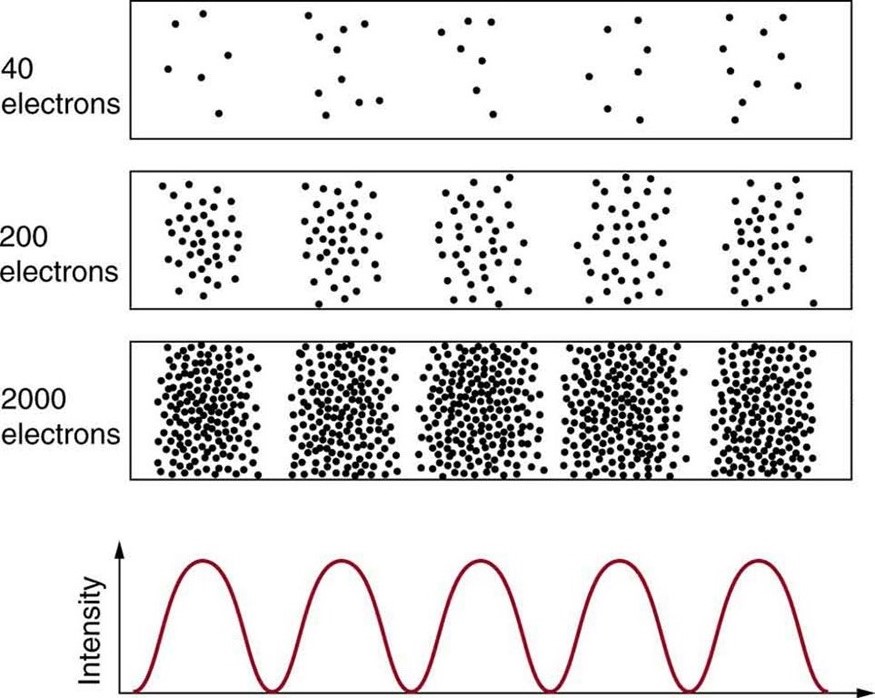
After de Broglie proposed the wave nature of matter, many physicists, including Schrödinger and Heisenberg, explored the consequences. The idea quickly emerged that, because of its wave character, a particle’s trajectory and destination cannot be precisely predicted for each particle individually . However, each particle goes to a definite place (as illustrated in [link] ). After compiling enough data, you get a distribution related to the particle’s wavelength and diffraction pattern. There is a certain probability of finding the particle at a given location, and the overall pattern is called a probability distribution    . Those who developed quantum mechanics devised equations that predicted the probability distribution in various circumstances.

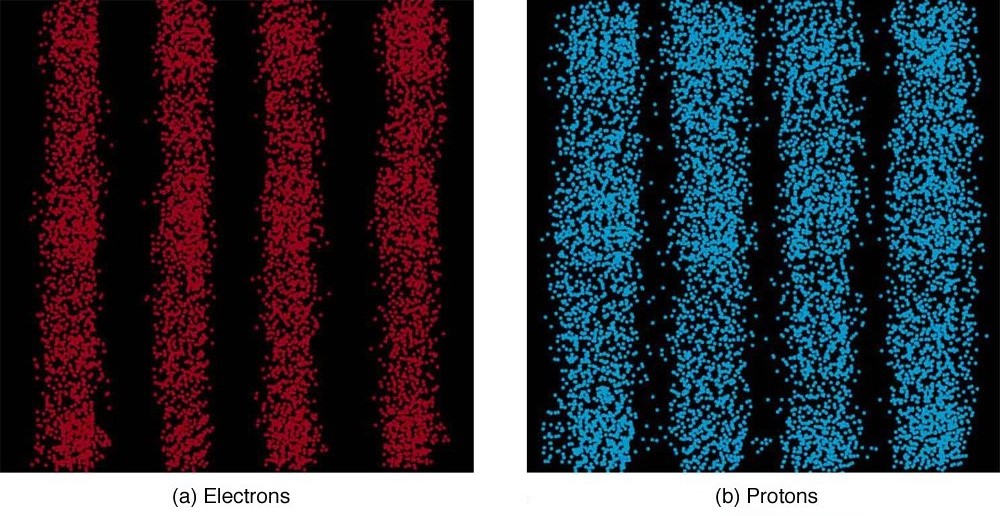
It is somewhat disquieting to think that you cannot predict exactly where an individual particle will go, or even follow it to its destination. Let us explore what happens if we try to follow a particle. Consider the double-slit patterns obtained for electrons and photons in [link] . First, we note that these patterns are identical, following d sin θ = size 12{d"sin"θ=mλ} {} , the equation for double-slit constructive interference developed in Photon Energies and the Electromagnetic Spectrum , where d size 12{d} {} is the slit separation and λ size 12{λ} {} is the electron or photon wavelength.

Questions & Answers

how do you get the 2/50
Abba Reply
number of sport play by 50 student construct discrete data
Aminu Reply
width of the frangebany leaves on how to write a introduction
Theresa Reply
Solve the mean of variance
Veronica Reply
Step 1: Find the mean. To find the mean, add up all the scores, then divide them by the number of scores. ... Step 2: Find each score's deviation from the mean. ... Step 3: Square each deviation from the mean. ... Step 4: Find the sum of squares. ... Step 5: Divide the sum of squares by n – 1 or N.
kenneth
what is error
Yakuba Reply
Is mistake done to something
Vutshila
Hy
anas
hy
What is the life teble
anas
hy
Jibrin
statistics is the analyzing of data
Tajudeen Reply
what is statics?
Zelalem Reply
how do you calculate mean
Gloria Reply
diveving the sum if all values
Shaynaynay
let A1,A2 and A3 events be independent,show that (A1)^c, (A2)^c and (A3)^c are independent?
Fisaye Reply
what is statistics
Akhisani Reply
data collected all over the world
Shaynaynay
construct a less than and more than table
Imad Reply
The sample of 16 students is taken. The average age in the sample was 22 years with astandard deviation of 6 years. Construct a 95% confidence interval for the age of the population.
Aschalew Reply
Bhartdarshan' is an internet-based travel agency wherein customer can see videos of the cities they plant to visit. The number of hits daily is a normally distributed random variable with a mean of 10,000 and a standard deviation of 2,400 a. what is the probability of getting more than 12,000 hits? b. what is the probability of getting fewer than 9,000 hits?
Akshay Reply
Bhartdarshan'is an internet-based travel agency wherein customer can see videos of the cities they plan to visit. The number of hits daily is a normally distributed random variable with a mean of 10,000 and a standard deviation of 2,400. a. What is the probability of getting more than 12,000 hits
Akshay
1
Bright
Sorry i want to learn more about this question
Bright
Someone help
Bright
a= 0.20233 b=0.3384
Sufiyan
a
Shaynaynay
How do I interpret level of significance?
Mohd Reply
It depends on your business problem or in Machine Learning you could use ROC- AUC cruve to decide the threshold value
Shivam
how skewness and kurtosis are used in statistics
Owen Reply
yes what is it
Taneeya
Got questions? Join the online conversation and get instant answers!
Jobilize.com Reply
Practice Key Terms 6

Get Jobilize Job Search Mobile App in your pocket Now!

Get it on Google Play Download on the App Store Now


Source:  OpenStax, College physics for ap® courses. OpenStax CNX. Nov 04, 2016 Download for free at https://legacy.cnx.org/content/col11844/1.14
Google Play and the Google Play logo are trademarks of Google Inc.

Notification Switch

Would you like to follow the 'College physics for ap® courses' conversation and receive update notifications?

Ask