<< Chapter < Page Chapter >> Page >

Extremely low frequency (ELF) radio waves of about 1 kHz are used to communicate with submerged submarines. The ability of radio waves to penetrate salt water is related to their wavelength (much like ultrasound penetrating tissue)—the longer the wavelength, the farther they penetrate. Since salt water is a good conductor, radio waves are strongly absorbed by it, and very long wavelengths are needed to reach a submarine under the surface. (See [link] .)
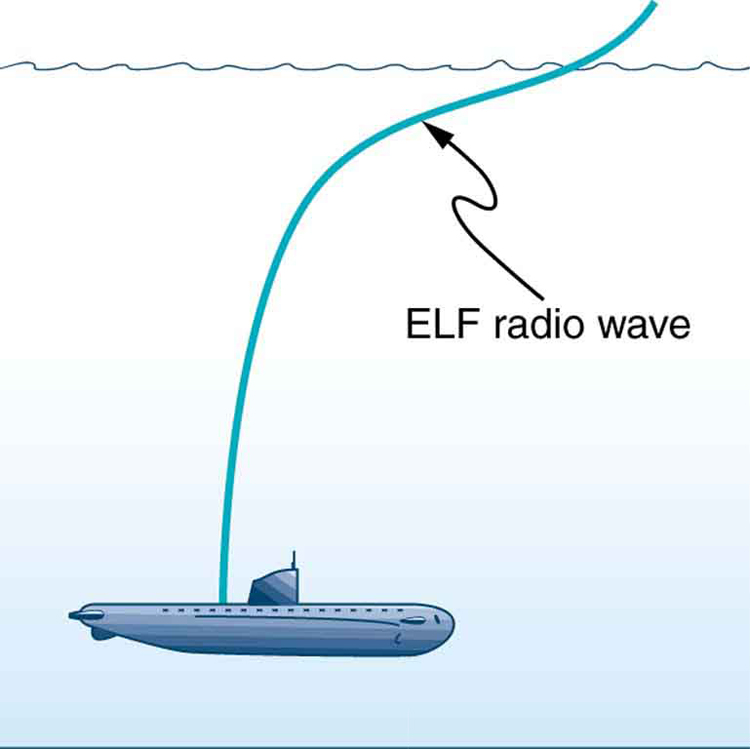
The picture of a submarine under water is shown. The submarine is shown to receive extremely low frequency signals shown as a curvy line from the ocean surface to the submarine in the ocean depth.
Very long wavelength radio waves are needed to reach this submarine, requiring extremely low frequency signals (ELF). Shorter wavelengths do not penetrate to any significant depth.

AM radio waves are used to carry commercial radio signals in the frequency range from 540 to 1600 kHz. The abbreviation AM stands for amplitude modulation , which is the method for placing information on these waves. (See [link] .) A carrier wave    having the basic frequency of the radio station, say 1530 kHz, is varied or modulated in amplitude by an audio signal. The resulting wave has a constant frequency, but a varying amplitude.

A radio receiver tuned to have the same resonant frequency as the carrier wave can pick up the signal, while rejecting the many other frequencies impinging on its antenna. The receiver’s circuitry is designed to respond to variations in amplitude of the carrier wave to replicate the original audio signal. That audio signal is amplified to drive a speaker or perhaps to be recorded.
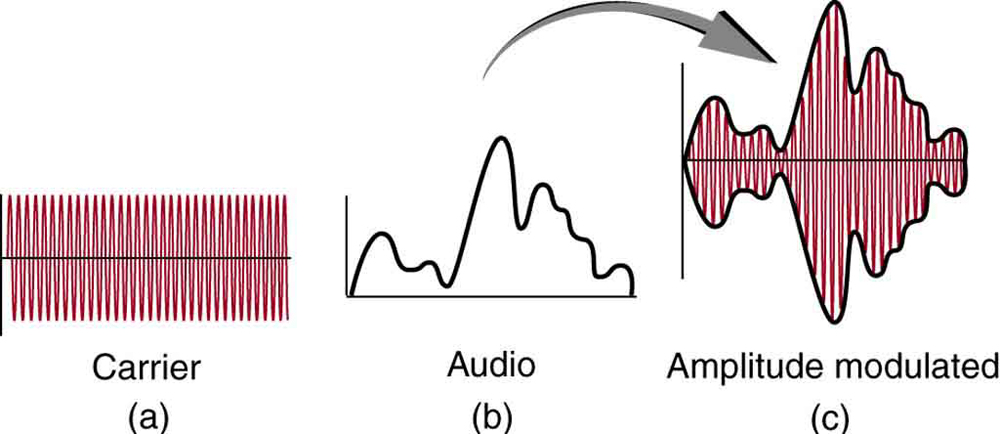
Part a of the diagram shows a carrier wave along the horizontal axis. The wave is shown to have a high frequency as the vibrations are closely spaced. The wave has constant amplitude represented by uniform height of crest and trough. Part b of the diagram shows an audio wave with a lower frequency. The wave is on the upper side of horizontal axis. The amplitude of the wave is not uniform. It has an initial small rise and fall followed by a steep rise and a gradual fall in the wave. Part c of the diagram shows the amplitude modulated wave. It is the resultant wave obtained by mixing of the waves in part a and part b. The amplitude of the resultant wave is non uniform, similar to the audio wave. The frequency of the amplitude modulated wave is equal to the frequency of the carrier wave. The wave spreads on both sides of the horizontal axis.
Amplitude modulation for AM radio. (a) A carrier wave at the station’s basic frequency. (b) An audio signal at much lower audible frequencies. (c) The amplitude of the carrier is modulated by the audio signal without changing its basic frequency.

Fm radio waves

FM radio waves are also used for commercial radio transmission, but in the frequency range of 88 to 108 MHz. FM stands for frequency modulation , another method of carrying information. (See [link] .) Here a carrier wave having the basic frequency of the radio station, perhaps 105.1 MHz, is modulated in frequency by the audio signal, producing a wave of constant amplitude but varying frequency.
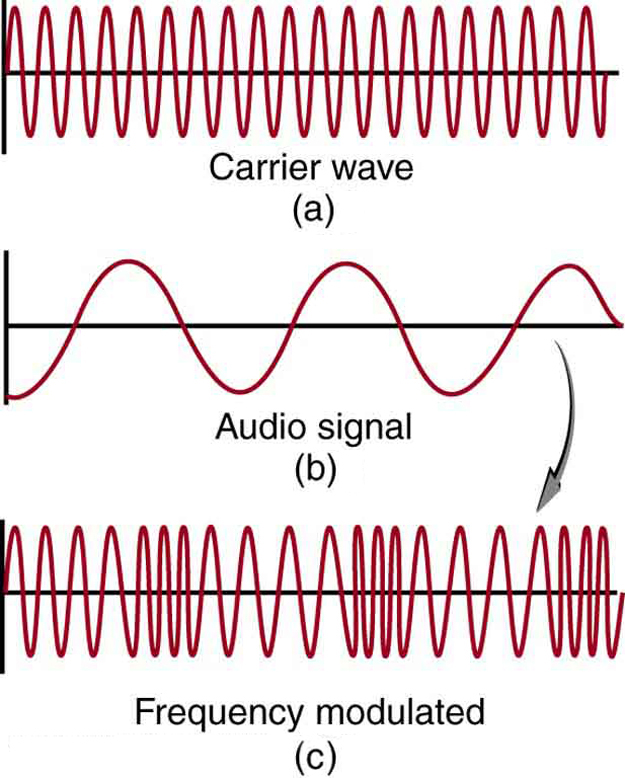
Part a of the diagram shows a carrier wave along the horizontal axis. The wave is shown to have a high frequency as the vibrations are closely spaced. The wave has constant amplitude represented by uniform height of crest and trough. Part b of the diagram shows an audio wave with a lower frequency as shown by widely spaced vibrations. The wave has constant amplitude, represented by uniform length of crest and trough. Part c shows the frequency modulated wave obtained from waves in part a and part b. The amplitude of the resultant wave is similar to the source waves but the frequency varies. Frequency maxima are shown as closely spaced vibrations and frequency minima are shown as widely spaced vibrations. These maxima and minima are shown to alternate.
Frequency modulation for FM radio. (a) A carrier wave at the station’s basic frequency. (b) An audio signal at much lower audible frequencies. (c) The frequency of the carrier is modulated by the audio signal without changing its amplitude.

Since audible frequencies range up to 20 kHz (or 0.020 MHz) at most, the frequency of the FM radio wave can vary from the carrier by as much as 0.020 MHz. Thus the carrier frequencies of two different radio stations cannot be closer than 0.020 MHz. An FM receiver is tuned to resonate at the carrier frequency and has circuitry that responds to variations in frequency, reproducing the audio information.

FM radio is inherently less subject to noise from stray radio sources than AM radio. The reason is that amplitudes of waves add. So an AM receiver would interpret noise added onto the amplitude of its carrier wave as part of the information. An FM receiver can be made to reject amplitudes other than that of the basic carrier wave and only look for variations in frequency. It is thus easier to reject noise from FM, since noise produces a variation in amplitude.

Questions & Answers

how do you get the 2/50
Abba Reply
number of sport play by 50 student construct discrete data
Aminu Reply
width of the frangebany leaves on how to write a introduction
Theresa Reply
Solve the mean of variance
Veronica Reply
Step 1: Find the mean. To find the mean, add up all the scores, then divide them by the number of scores. ... Step 2: Find each score's deviation from the mean. ... Step 3: Square each deviation from the mean. ... Step 4: Find the sum of squares. ... Step 5: Divide the sum of squares by n – 1 or N.
kenneth
what is error
Yakuba Reply
Is mistake done to something
Vutshila
Hy
anas
hy
What is the life teble
anas
hy
Jibrin
statistics is the analyzing of data
Tajudeen Reply
what is statics?
Zelalem Reply
how do you calculate mean
Gloria Reply
diveving the sum if all values
Shaynaynay
let A1,A2 and A3 events be independent,show that (A1)^c, (A2)^c and (A3)^c are independent?
Fisaye Reply
what is statistics
Akhisani Reply
data collected all over the world
Shaynaynay
construct a less than and more than table
Imad Reply
The sample of 16 students is taken. The average age in the sample was 22 years with astandard deviation of 6 years. Construct a 95% confidence interval for the age of the population.
Aschalew Reply
Bhartdarshan' is an internet-based travel agency wherein customer can see videos of the cities they plant to visit. The number of hits daily is a normally distributed random variable with a mean of 10,000 and a standard deviation of 2,400 a. what is the probability of getting more than 12,000 hits? b. what is the probability of getting fewer than 9,000 hits?
Akshay Reply
Bhartdarshan'is an internet-based travel agency wherein customer can see videos of the cities they plan to visit. The number of hits daily is a normally distributed random variable with a mean of 10,000 and a standard deviation of 2,400. a. What is the probability of getting more than 12,000 hits
Akshay
1
Bright
Sorry i want to learn more about this question
Bright
Someone help
Bright
a= 0.20233 b=0.3384
Sufiyan
a
Shaynaynay
How do I interpret level of significance?
Mohd Reply
It depends on your business problem or in Machine Learning you could use ROC- AUC cruve to decide the threshold value
Shivam
how skewness and kurtosis are used in statistics
Owen Reply
yes what is it
Taneeya
Got questions? Join the online conversation and get instant answers!
Jobilize.com Reply

Get Jobilize Job Search Mobile App in your pocket Now!

Get it on Google Play Download on the App Store Now


Source:  OpenStax, College physics for ap® courses. OpenStax CNX. Nov 04, 2016 Download for free at https://legacy.cnx.org/content/col11844/1.14
Google Play and the Google Play logo are trademarks of Google Inc.

Notification Switch

Would you like to follow the 'College physics for ap® courses' conversation and receive update notifications?

Ask