<< Chapter < Page Chapter >> Page >
A bar graph depicting world energy consumption is shown. The year is listed on the horizontal axis and energy consumed is listed on the vertical axis. Energy consumption by the world is shown for different years. Energy consumption rises over time. In the year nineteen hundred and ninety it was three hundred seventy three multiplied by ten to the power eighteen joules, and the projection is that it will become eight hundred twelve multiplied by ten to the power eighteen joules by the year twenty thirty five.
Past and projected world energy use (source: Based on data from U.S. Energy Information Administration, 2011)
Solar cell arrays lined up in a field.
Solar cell arrays at a power plant in Steindorf, Germany (credit: Michael Betke, Flickr)

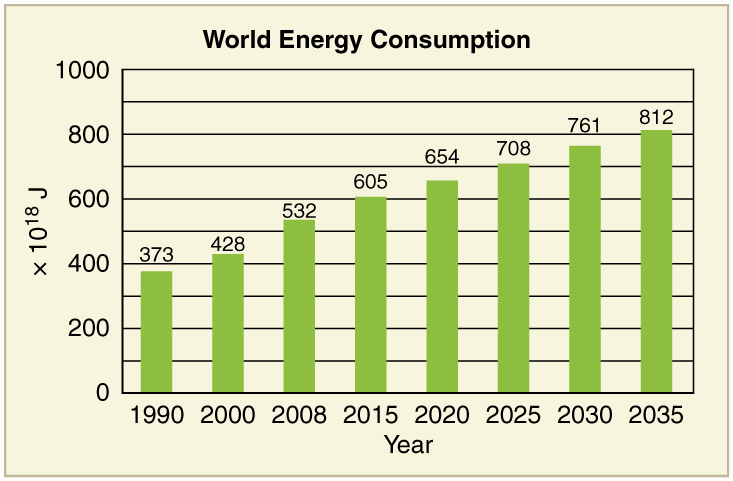
[link] displays the 2006 commercial energy mix by country for some of the prime energy users in the world. While non-renewable sources dominate, some countries get a sizeable percentage of their electricity from renewable resources. For example, about 67% of New Zealand’s electricity demand is met by hydroelectric. Only 10% of the U.S. electricity is generated by renewable resources, primarily hydroelectric. It is difficult to determine total contributions of renewable energy in some countries with a large rural population, so these percentages in this table are left blank.

Energy consumption—selected countries (2006)
Country Consumption, in EJ (10 18 J) Oil Natural Gas Coal Nuclear Hydro Other Renewables Electricity Use per capita (kWh/yr) Energy Use per capita (GJ/yr)
Australia 5.4 34% 17% 44% 0% 3% 1% 10000 260
Brazil 9.6 48% 7% 5% 1% 35% 2% 2000 50
China 63 22% 3% 69% 1% 6% 1500 35
Egypt 2.4 50% 41% 1% 0% 6% 990 32
Germany 16 37% 24% 24% 11% 1% 3% 6400 173
India 15 34% 7% 52% 1% 5% 470 13
Indonesia 4.9 51% 26% 16% 0% 2% 3% 420 22
Japan 24 48% 14% 21% 12% 4% 1% 7100 176
New Zealand 0.44 32% 26% 6% 0% 11% 19% 8500 102
Russia 31 19% 53% 16% 5% 6% 5700 202
U.S. 105 40% 23% 22% 8% 3% 1% 12500 340
World 432 39% 23% 24% 6% 6% 2% 2600 71

Energy and economic well-being

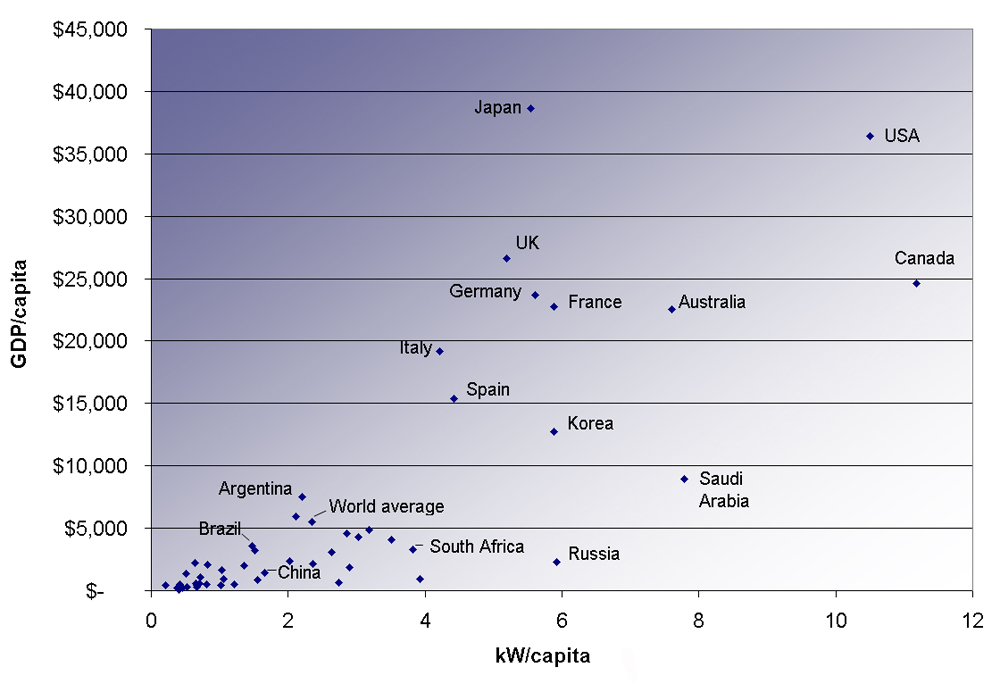
The last two columns in this table examine the energy and electricity use per capita. Economic well-being is dependent upon energy use, and in most countries higher standards of living, as measured by GDP (gross domestic product) per capita, are matched by higher levels of energy consumption per capita. This is borne out in [link] . Increased efficiency of energy use will change this dependency. A global problem is balancing energy resource development against the harmful effects upon the environment in its extraction and use.

A scatter plot of power consumption per capita versus G D P per capita for various countries. Power consumption in kilowatt per capita is shown along the horizontal axis and G D P per capita is show along the vertical axis.
Power consumption per capita versus GDP per capita for various countries. Note the increase in energy usage with increasing GDP. (2007, credit: Frank van Mierlo, Wikimedia Commons)

Conserving energy

As we finish this chapter on energy and work, it is relevant to draw some distinctions between two sometimes misunderstood terms in the area of energy use. As has been mentioned elsewhere, the “law of the conservation of energy” is a very useful principle in analyzing physical processes. It is a statement that cannot be proven from basic principles, but is a very good bookkeeping device, and no exceptions have ever been found. It states that the total amount of energy in an isolated system will always remain constant. Related to this principle, but remarkably different from it, is the important philosophy of energy conservation. This concept has to do with seeking to decrease the amount of energy used by an individual or group through (1) reduced activities (e.g., turning down thermostats, driving fewer kilometers) and/or (2) increasing conversion efficiencies in the performance of a particular task—such as developing and using more efficient room heaters, cars that have greater miles-per-gallon ratings, energy-efficient compact fluorescent lights, etc.

Questions & Answers

Ayele, K., 2003. Introductory Economics, 3rd ed., Addis Ababa.
Widad Reply
can you send the book attached ?
Ariel
?
Ariel
What is economics
Widad Reply
the study of how humans make choices under conditions of scarcity
AI-Robot
U(x,y) = (x×y)1/2 find mu of x for y
Desalegn Reply
U(x,y) = (x×y)1/2 find mu of x for y
Desalegn
what is ecnomics
Jan Reply
this is the study of how the society manages it's scarce resources
Belonwu
what is macroeconomic
John Reply
macroeconomic is the branch of economics which studies actions, scale, activities and behaviour of the aggregate economy as a whole.
husaini
etc
husaini
difference between firm and industry
husaini Reply
what's the difference between a firm and an industry
Abdul
firm is the unit which transform inputs to output where as industry contain combination of firms with similar production 😅😅
Abdulraufu
Suppose the demand function that a firm faces shifted from Qd  120 3P to Qd  90  3P and the supply function has shifted from QS  20  2P to QS 10  2P . a) Find the effect of this change on price and quantity. b) Which of the changes in demand and supply is higher?
Toofiq Reply
explain standard reason why economic is a science
innocent Reply
factors influencing supply
Petrus Reply
what is economic.
Milan Reply
scares means__________________ends resources. unlimited
Jan
economics is a science that studies human behaviour as a relationship b/w ends and scares means which have alternative uses
Jan
calculate the profit maximizing for demand and supply
Zarshad Reply
Why qualify 28 supplies
Milan
what are explicit costs
Nomsa Reply
out-of-pocket costs for a firm, for example, payments for wages and salaries, rent, or materials
AI-Robot
concepts of supply in microeconomics
David Reply
economic overview notes
Amahle Reply
identify a demand and a supply curve
Salome Reply
i don't know
Parul
there's a difference
Aryan
Demand curve shows that how supply and others conditions affect on demand of a particular thing and what percent demand increase whith increase of supply of goods
Israr
Hi Sir please how do u calculate Cross elastic demand and income elastic demand?
Abari
Got questions? Join the online conversation and get instant answers!
Jobilize.com Reply
Practice Key Terms 2

Get Jobilize Job Search Mobile App in your pocket Now!

Get it on Google Play Download on the App Store Now


Source:  OpenStax, College physics for ap® courses. OpenStax CNX. Nov 04, 2016 Download for free at https://legacy.cnx.org/content/col11844/1.14
Google Play and the Google Play logo are trademarks of Google Inc.

Notification Switch

Would you like to follow the 'College physics for ap® courses' conversation and receive update notifications?

Ask