<< Chapter < Page Chapter >> Page >
  • Observe resonance of a paddle ball on a string.
  • Observe amplitude of a damped harmonic oscillator.
The figure shows the panel of the piano containing the strings, which are visibly in horizontal lines. Just below the strings is the wooden block of the piano containing the different type string handle bars and blocks.
You can cause the strings in a piano to vibrate simply by producing sound waves from your voice. (credit: Matt Billings, Flickr)

Sit in front of a piano sometime and sing a loud brief note at it with the dampers off its strings. It will sing the same note back at you—the strings, having the same frequencies as your voice, are resonating in response to the forces from the sound waves that you sent to them. Your voice and a piano’s strings is a good example of the fact that objects—in this case, piano strings—can be forced to oscillate but oscillate best at their natural frequency. In this section, we shall briefly explore applying a periodic driving force acting on a simple harmonic oscillator. The driving force puts energy into the system at a certain frequency, not necessarily the same as the natural frequency of the system. The natural frequency    is the frequency at which a system would oscillate if there were no driving and no damping force.

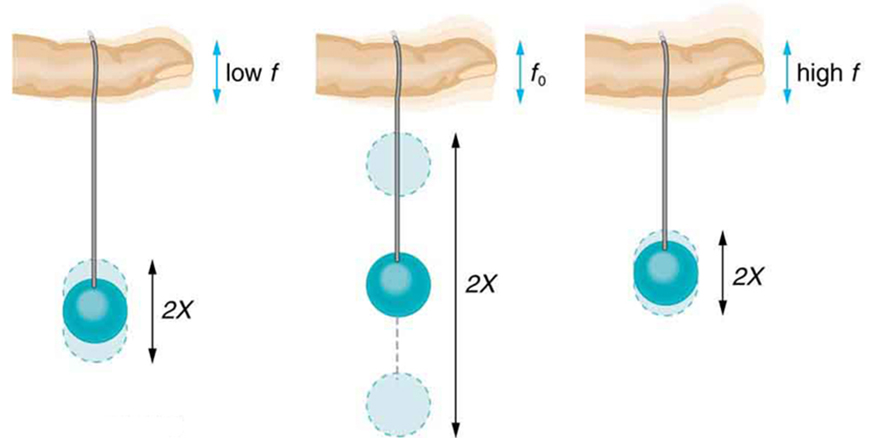
Most of us have played with toys involving an object supported on an elastic band, something like the paddle ball suspended from a finger in [link] . Imagine the finger in the figure is your finger. At first you hold your finger steady, and the ball bounces up and down with a small amount of damping. If you move your finger up and down slowly, the ball will follow along without bouncing much on its own. As you increase the frequency at which you move your finger up and down, the ball will respond by oscillating with increasing amplitude. When you drive the ball at its natural frequency, the ball’s oscillations increase in amplitude with each oscillation for as long as you drive it. The phenomenon of driving a system with a frequency equal to its natural frequency is called resonance    . A system being driven at its natural frequency is said to resonate    . As the driving frequency gets progressively higher than the resonant or natural frequency, the amplitude of the oscillations becomes smaller, until the oscillations nearly disappear and your finger simply moves up and down with little effect on the ball.

The given figure shows three pictures of a horizontal viewed single finger containing a string, suspended downward vertically, being tied to a paddle ball at its downward end. In the first figure the ball is stretching up and down very slowly having less displacement, the displacement shown in the figures as faded shades of the ball and is depicted as 2X. Whereas in the second figure the movement of the ball is highest, while in the third the movement is least. In all the three figures the ball is at its equilibrium with respect to its movement. The frequency, f, for the first figure is very low, for the second figure as f not, while for the third figure it is highest.
The paddle ball on its rubber band moves in response to the finger supporting it. If the finger moves with the natural frequency f 0 size 12{f rSub { size 8{0} } } {} of the ball on the rubber band, then a resonance is achieved, and the amplitude of the ball’s oscillations increases dramatically. At higher and lower driving frequencies, energy is transferred to the ball less efficiently, and it responds with lower-amplitude oscillations.

[link] shows a graph of the amplitude of a damped harmonic oscillator as a function of the frequency of the periodic force driving it. There are three curves on the graph, each representing a different amount of damping. All three curves peak at the point where the frequency of the driving force equals the natural frequency of the harmonic oscillator. The highest peak, or greatest response, is for the least amount of damping, because less energy is removed by the damping force.

Questions & Answers

how do you get the 2/50
Abba Reply
number of sport play by 50 student construct discrete data
Aminu Reply
width of the frangebany leaves on how to write a introduction
Theresa Reply
Solve the mean of variance
Veronica Reply
Step 1: Find the mean. To find the mean, add up all the scores, then divide them by the number of scores. ... Step 2: Find each score's deviation from the mean. ... Step 3: Square each deviation from the mean. ... Step 4: Find the sum of squares. ... Step 5: Divide the sum of squares by n – 1 or N.
kenneth
what is error
Yakuba Reply
Is mistake done to something
Vutshila
Hy
anas
hy
What is the life teble
anas
hy
Jibrin
statistics is the analyzing of data
Tajudeen Reply
what is statics?
Zelalem Reply
how do you calculate mean
Gloria Reply
diveving the sum if all values
Shaynaynay
let A1,A2 and A3 events be independent,show that (A1)^c, (A2)^c and (A3)^c are independent?
Fisaye Reply
what is statistics
Akhisani Reply
data collected all over the world
Shaynaynay
construct a less than and more than table
Imad Reply
The sample of 16 students is taken. The average age in the sample was 22 years with astandard deviation of 6 years. Construct a 95% confidence interval for the age of the population.
Aschalew Reply
Bhartdarshan' is an internet-based travel agency wherein customer can see videos of the cities they plant to visit. The number of hits daily is a normally distributed random variable with a mean of 10,000 and a standard deviation of 2,400 a. what is the probability of getting more than 12,000 hits? b. what is the probability of getting fewer than 9,000 hits?
Akshay Reply
Bhartdarshan'is an internet-based travel agency wherein customer can see videos of the cities they plan to visit. The number of hits daily is a normally distributed random variable with a mean of 10,000 and a standard deviation of 2,400. a. What is the probability of getting more than 12,000 hits
Akshay
1
Bright
Sorry i want to learn more about this question
Bright
Someone help
Bright
a= 0.20233 b=0.3384
Sufiyan
a
Shaynaynay
How do I interpret level of significance?
Mohd Reply
It depends on your business problem or in Machine Learning you could use ROC- AUC cruve to decide the threshold value
Shivam
how skewness and kurtosis are used in statistics
Owen Reply
yes what is it
Taneeya
Got questions? Join the online conversation and get instant answers!
Jobilize.com Reply
Practice Key Terms 3

Get Jobilize Job Search Mobile App in your pocket Now!

Get it on Google Play Download on the App Store Now


Source:  OpenStax, College physics. OpenStax CNX. Jul 27, 2015 Download for free at http://legacy.cnx.org/content/col11406/1.9
Google Play and the Google Play logo are trademarks of Google Inc.

Notification Switch

Would you like to follow the 'College physics' conversation and receive update notifications?

Ask