

| << Chapter < Page | Chapter >> Page > |
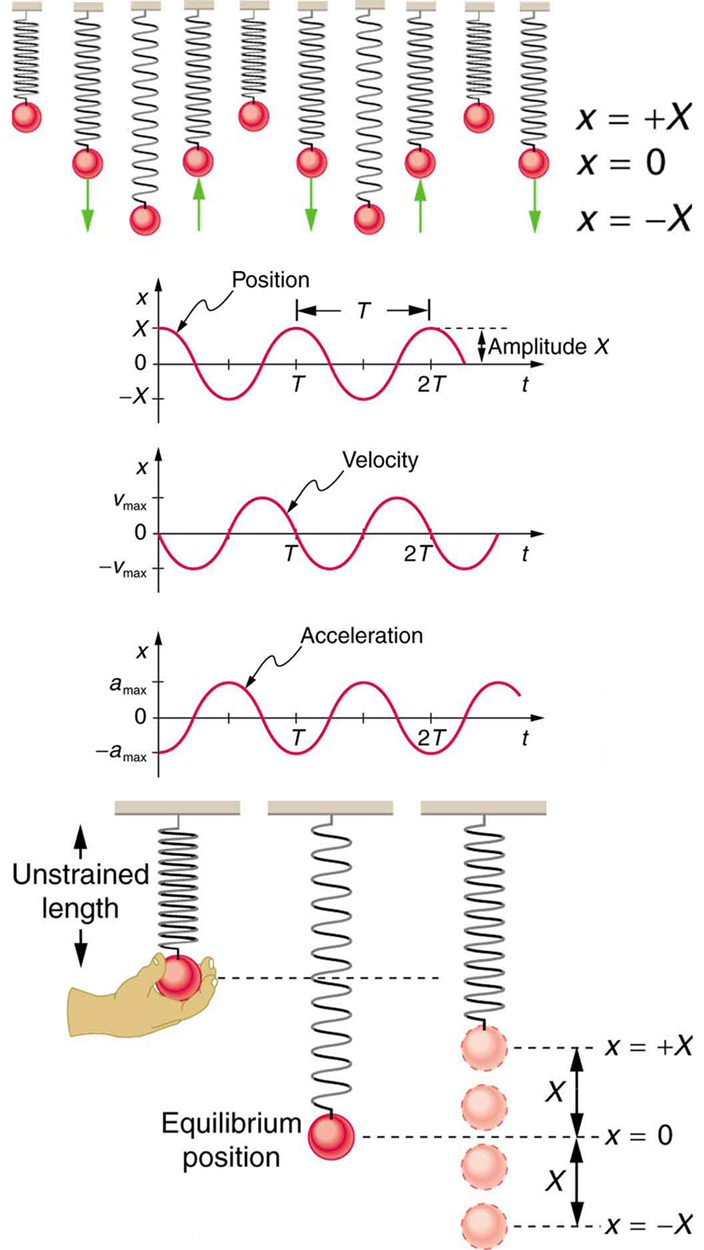
where . The object has zero velocity at maximum displacement—for example, when , and at that time . The minus sign in the first equation for gives the correct direction for the velocity. Just after the start of the motion, for instance, the velocity is negative because the system is moving back toward the equilibrium point. Finally, we can get an expression for acceleration using Newton’s second law. [Then we have and , the quantities needed for kinematics and a description of simple harmonic motion.] According to Newton’s second law, the acceleration is . So, is also a cosine function:
Hence, is directly proportional to and in the opposite direction to .
[link] shows the simple harmonic motion of an object on a spring and presents graphs of and versus time.
The most important point here is that these equations are mathematically straightforward and are valid for all simple harmonic motion. They are very useful in visualizing waves associated with simple harmonic motion, including visualizing how waves add with one another.
Suppose you pluck a banjo string. You hear a single note that starts out loud and slowly quiets over time. Describe what happens to the sound waves in terms of period, frequency and amplitude as the sound decreases in volume.
Frequency and period remain essentially unchanged. Only amplitude decreases as volume decreases.
A babysitter is pushing a child on a swing. At the point where the swing reaches , where would the corresponding point on a wave of this motion be located?
is the maximum deformation, which corresponds to the amplitude of the wave. The point on the wave would either be at the very top or the very bottom of the curve.
A realistic mass and spring laboratory. Hang masses from springs and adjust the spring stiffness and damping. You can even slow time. Transport the lab to different planets. A chart shows the kinetic, potential, and thermal energy for each spring.
and , where is the mass of the system.
Notification Switch
Would you like to follow the 'College physics' conversation and receive update notifications?

|
|
|
|
|

|
|

|
|

|
|

|
|

|
|

|
|

|
|

|
|
|
|
|

|