

| << Chapter < Page | Chapter >> Page > |
A tree diagram is a special type of graph used to determine the outcomes of an experiment. It consists of "branches" that are labeled with either frequencies or probabilities. Tree diagrams can make some probability problems easier to visualize and solve. The following example illustrates how to use a tree diagram.
In an urn, there are 11 balls. Three balls are red ( ) and 8 balls are blue ( ). Draw two balls, one at a time, with replacement . "With replacement" means that you put the first ball back in the urn before you select the second ball. The tree diagram using frequencies that show all the possible outcomes follows.
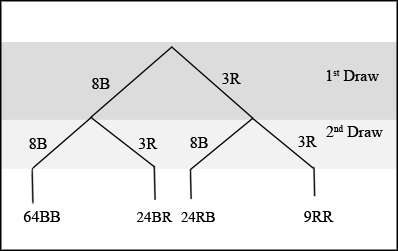
The first set of branches represents the first draw. The second set of branches represents the second draw. Each of the outcomes is distinct. In fact, we can list each red ball as , , and and each blue ball as , , , , , , , and . Then the 9 outcomes can be written as:
The other outcomes are similar.
There are a total of 11 balls in the urn. Draw two balls, one at a time, and with replacement. There are outcomes, the size of the sample space .
Using the tree diagram, calculate .
This problem is a conditional. The sample space has been reduced to those outcomes that already have a blue on the first draw. There are possible outcomes (24 and 64 ). Twenty-four of the 88 possible outcomes are . .
Using the tree diagram, calculate .
There are outcomes that have on the first draw (9 and 24 ). The sample space is then . Twenty-four of the 33 outcomes have on the second draw. The probability is then .
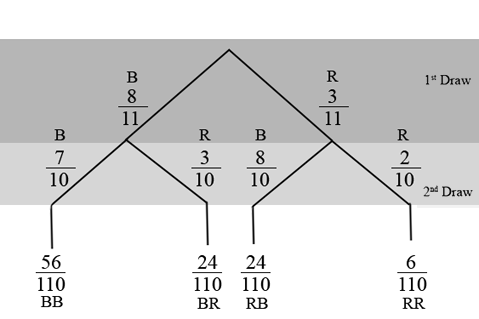
An urn has 3 red marbles and 8 blue marbles in it. Draw two marbles, one at a time, this time without replacement from the urn. "Without replacement" means that you do not put the first ball back before you select the second ball. Below is a tree diagram. The branches are labeled with probabilities instead of frequencies. The numbers at the ends of the branches are calculated by multiplying the numbers on the two corresponding branches, for example, .
Calculate the following probabilities using the tree diagram.
=
There are outcomes that have on the first draw (6 and 24 ). The 6 and the 24 are frequencies. They are also the numerators of the fractions and . The sample space is no longer 110 but . Twenty-four of the 30 outcomes have on the second draw. The probability is then . Did you get this answer?
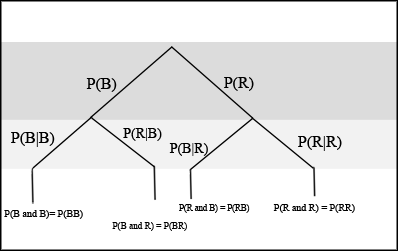
If we are using probabilities, we can label the tree in the following general way.
Notification Switch
Would you like to follow the 'Collaborative statistics' conversation and receive update notifications?

|
|

|
|

|
|

|
|
|
|
|

|
|

|
|

|
|

|
|

|