<< Chapter < Page Chapter >> Page >

Components of gdp on the demand side

This is a line graph with parts a and b. Part a shows the demand from consumption, investment, and government from the year 1960 to 2014. In 1960, the graph starts out at 61.0% for consumption. It remains fairly steady around 60% until 1993, when it is at 65%.  By 2014, it is at 68.5%. In 1960, the graph starts out at 22.3% for government. It remains steady around 20%, and by 2014, it is at 18.2%. In 1960, the graph starts out at 15.9% for investment. It rises gradually to 20.3% in 1978, then generally goes down to 16.4% in 2014.   Part b shows imports and exports from the year 1960 to 2014. In 1960, the graph starts out at 4.2% for imports. It rises fairly steadily with only a few drops, such as from 14.3% in 2000 to 13.1% in 2001. By 2014 it is at 16.5%. In 1960, the graph starts out at 5.0% for exports. It remains steadily around 5% until 1973, when it jumps to 6.7%. By 2014, the exports line is at 13.4%.
(a) Consumption is about two-thirds of GDP, but it moves relatively little over time. Business investment hovers around 15% of GDP, but it increases and declines more than consumption. Government spending on goods and services is around 20% of GDP. (b) Exports are added to total demand for goods and services, while imports are subtracted from total demand. If exports exceed imports, as in most of the 1960s and 1970s in the U.S. economy, a trade surplus exists. If imports exceed exports, as in recent years, then a trade deficit exists. (Source: http://bea.gov/iTable/index_nipa.cfm)

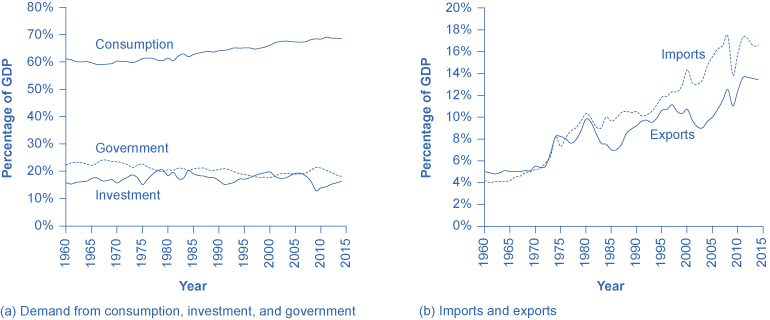
Consumption expenditure by households is the largest component of GDP, accounting for about two-thirds of the GDP in any year. This tells us that consumers’ spending decisions are a major driver of the economy. However, consumer spending is a gentle elephant: when viewed over time, it does not jump around too much.

Investment expenditure refers to purchases of physical plant and equipment, primarily by businesses. If Starbucks builds a new store, or Amazon buys robots, these expenditures are counted under business investment. Investment demand is far smaller than consumption demand , typically accounting for only about 15–18% of GDP, but it is very important for the economy because this is where jobs are created. However, it fluctuates more noticeably than consumption. Business investment is volatile; new technology or a new product can spur business investment, but then confidence can drop and business investment can pull back sharply.

If you have noticed any of the infrastructure projects (new bridges, highways, airports) launched during the recession of 2009, you have seen how important government spending can be for the economy. Government expenditure in the United States is about 20% of GDP, and includes spending by all three levels of government: federal, state, and local. The only part of government spending counted in demand is government purchases of goods or services produced in the economy. Examples include the government buying a new fighter jet for the Air Force (federal government spending), building a new highway (state government spending), or a new school (local government spending). A significant portion of government budgets are transfer payments, like unemployment benefits, veteran’s benefits, and Social Security payments to retirees. These payments are excluded from GDP because the government does not receive a new good or service in return or exchange. Instead they are transfers of income from taxpayers to others. If you are curious about the awesome undertaking of adding up GDP, read the following Clear It Up feature.

How do statisticians measure gdp?

Government economists at the Bureau of Economic Analysis (BEA), within the U.S. Department of Commerce, piece together estimates of GDP from a variety of sources.

Once every five years, in the second and seventh year of each decade, the Bureau of the Census carries out a detailed census of businesses throughout the United States. In between, the Census Bureau carries out a monthly survey of retail sales. These figures are adjusted with foreign trade data to account for exports that are produced in the United States and sold abroad and for imports that are produced abroad and sold here. Once every ten years, the Census Bureau conducts a comprehensive survey of housing and residential finance. Together, these sources provide the main basis for figuring out what is produced for consumers.

For investment, the Census Bureau carries out a monthly survey of construction and an annual survey of expenditures on physical capital equipment.

For what is purchased by the federal government, the statisticians rely on the U.S. Department of the Treasury. An annual Census of Governments gathers information on state and local governments. Because a lot of government spending at all levels involves hiring people to provide services, a large portion of government spending is also tracked through payroll records collected by state governments and by the Social Security Administration.

With regard to foreign trade, the Census Bureau compiles a monthly record of all import and export documents. Additional surveys cover transportation and travel, and adjustment is made for financial services that are produced in the United States for foreign customers.

Many other sources contribute to the estimates of GDP. Information on energy comes from the U.S. Department of Transportation and Department of Energy. Information on healthcare is collected by the Agency for Health Care Research and Quality. Surveys of landlords find out about rental income. The Department of Agriculture collects statistics on farming.

All of these bits and pieces of information arrive in different forms, at different time intervals. The BEA melds them together to produce estimates of GDP on a quarterly basis (every three months). These numbers are then “annualized” by multiplying by four. As more information comes in, these estimates are updated and revised. The “advance” estimate of GDP for a certain quarter is released one month after a quarter. The “preliminary” estimate comes out one month after that. The “final” estimate is published one month later, but it is not actually final. In July, roughly updated estimates for the previous calendar year are released. Then, once every five years, after the results of the latest detailed five-year business census have been processed, the BEA revises all of the past estimates of GDP according to the newest methods and data, going all the way back to 1929.

Questions & Answers

it is the relatively stable flow of income
Chidubem Reply
what is circular flow of income
Divine Reply
branches of macroeconomics
SHEDRACK Reply
what is Flexible exchang rate?
poudel Reply
is gdp a reliable measurement of wealth
Atega Reply
introduction to econometrics
Husseini Reply
Hi
mostafa
hi
LEMLEM
hello
Sammol
hi
Mahesh
bi
Ruqayat
hi
Ruqayat
Hi fellas
Nyawa
hey
Sammol
hi
God
hello
Jahara
Good morning
Jorge
hi
abubakar
hi
Nmesoma
hi
Mahesh
Hi
Tom
Why is unemployment rate never zero at full employment?
Priyanka Reply
bcoz of existence of frictional unemployment in our economy.
Umashankar
what is flexible exchang rate?
poudel
due to existence of the pple with disabilities
Abdulraufu
the demand of a good rises, causing the demand for another good to fall
Rushawn Reply
is it possible to leave every good at the same level
Joseph
I don't think so. because check it, if the demand for chicken increases, people will no longer consume fish like they used to causing a fall in the demand for fish
Anuolu
is not really possible to let the value of a goods to be same at the same time.....
Salome
Suppose the inflation rate is 6%, does it mean that all the goods you purchase will cost 6% more than previous year? Provide with reasoning.
Geetha Reply
Not necessarily. To measure the inflation rate economists normally use an averaged price index of a basket of certain goods. So if you purchase goods included in the basket, you will notice that you pay 6% more, otherwise not necessarily.
Waeth
discus major problems of macroeconomics
Alii Reply
what is the problem of macroeconomics
Yoal
Economic growth Stable prices and low unemployment
Ephraim
explain inflationcause and itis degre
Miresa Reply
what is inflation
Getu
increase in general price levels
WEETO
Good day How do I calculate this question: C= 100+5yd G= 2000 T= 2000 I(planned)=200. Suppose the actual output is 3000. What is the level of planned expenditures at this level of output?
Chisomo Reply
how to calculate actual output?
Chisomo
how to calculate the equilibrium income
Beshir
Criteria for determining money supply
Thapase Reply
who we can define macroeconomics in one line
Muhammad
Aggregate demand
Mohammed
C=k100 +9y and i=k50.calculate the equilibrium level of output
Mercy Reply
Hi
Isiaka
Hi
Geli
hy
Man
👋
Bahunda
hy how are you?
Man
ys
Amisha
how are you guys
Sekou
f9 guys
Amisha
how are you guys
Sekou
ys am also fine
Amisha
fine and you guys
Geli
from Nepal
Amisha
nawalparasi district from belatari
Amisha
nd u
Amisha
I am Camara from Guinea west Africa... happy to meet you guys here
Sekou
ma management ho
Amisha
ahile becheclor ho
Amisha
hjr ktm bta ho ani k kaam grnu hunxa tw
Amisha
belatari
Amisha
1st year ho
Amisha
nd u
Amisha
ahh
Amisha
kaha biratnagar
Amisha
ys
Amisha
kina k vo
Amisha
money as unit of account means what?
Kalombe
A unit of account is something that can be used to value goods and services and make calculations
Jim
all of you please speak in English I can't understand you're language
Muhammad
I want to know how can we define macroeconomics in one line
Muhammad
it must be .9 or 0.9 no Mpc is greater than 1 Y=100+.9Y+50 Y-.9Y=150 0.1Y/0.1=150/0.1 Y=1500
Kalombe
Mercy is it clear?😋
Kalombe
hi can someone help me on this question If a negative shocks shifts the IS curve to the left, what type of policy do you suggest so as to stabilize the level of output? discuss your answer using appropriate graph.
Galge Reply
if interest rate is increased this will will reduce the level of income shifting the curve to the left ◀️
Kalombe
Got questions? Join the online conversation and get instant answers!
Jobilize.com Reply

Get Jobilize Job Search Mobile App in your pocket Now!

Get it on Google Play Download on the App Store Now


Source:  OpenStax, University of houston downtown: macroeconomics. OpenStax CNX. May 28, 2014 Download for free at http://legacy.cnx.org/content/col11653/1.3
Google Play and the Google Play logo are trademarks of Google Inc.

Notification Switch

Would you like to follow the 'University of houston downtown: macroeconomics' conversation and receive update notifications?

Ask