To analyse data for meaningful patterns and measures
[LO 5.3]
Now we need to gather information about the heights of the learners in your class. Fasten a measuring tape like the one dressmakers use to the side of the door, so that it is perfectly vertical. If you can’t find a tape, you can use some other way – maybe making small marks very accurately every centimetre on the wall, using rulers.
Each learner takes off her shoes and stands with her heels and back tightly against the wall. Someone who is tall enough holds a ruler or piece of cardboard flat on her head to see exactly how tall she is. It is a good idea to take the measurement in centimetres and not in millimetres. Write the answer on her hand (or on a piece of paper).
We do our first calculation in an interesting way: When everyone has been measured, all the pupils stand in line
in the order of their heights.
From this line of pupils we get the
first measurement of the average of the class. Write down the height of the pupil who is exactly in the centre of the line (equally far from the beginning as from the end). This number is called the
median . There are as many learners shorter than she is, as there are taller than she is. Note: if there are an even number of learners in the class, then of course there will not be a middle person. In that case we take the two middle persons, add their heights and divide the answer by two.
Write down the median height for your class. If you are in a class with both boys and girls, work out the medians for the boys and girls separately
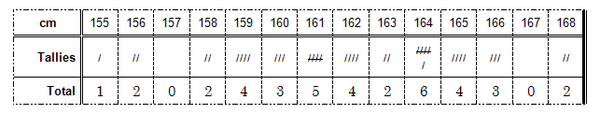
Next make a frequency table for the heights and use tallies to count how many of each height you have in the class.
Go back to the table of ages of siblings and find the median age of the boys and girls separately. Your table is likely to be very big, but here is a smaller example of what you should do:
See whether you agree that the median height for this group is 162 cm.
If you study the numbers in the last row (they give the frequencies of the different heights) you will see that 164 cm is the height that occurs most often as there are six learners who are 164 cm tall. This number is called the
mode . We can think of it as the most popular height.
The ne
x t calculation is the one that gives us the value that we usually call the
average . Its proper name is the
arithmetic mean , or just
mean . You may already know how to calculate it: you add all the values and then divide the answer by the number of values. For the table above you divide 6156 by 38 to get a mean height for the class of 162 cm.
.We can make a table of these values:Use the table of ages of siblings again and calculate the mode and mean for boys and girls separately and then fill these values in on a table like the one alongside
Median
162 cm
Mode
164 cm
Mean
162 cm
These values (mode, median and mean) are together called
measures of central tendency . They are all different kinds of
averages . That is why, when we use the word
average to refer to the arithmetic mean, we are not being perfectly accurate. From now on, you can use the word
mean where you would have said
average before.
In economics, a perfect market refers to a theoretical construct where all participants have perfect information, goods are homogenous, there are no barriers to entry or exit, and prices are determined solely by supply and demand. It's an idealized model used for analysis,
When MP₁ becomes negative, TP start to decline.
Extuples Suppose that the short-run production function of certain cut-flower firm is given by: Q=4KL-0.6K2 - 0.112 •
Where is quantity of cut flower produced, I is labour input and K is fixed capital input (K-5). Determine the average product of lab
Kelo
Extuples Suppose that the short-run production function of certain cut-flower firm is given by: Q=4KL-0.6K2 - 0.112 •
Where is quantity of cut flower produced, I is labour input and K is fixed capital input (K-5). Determine the average product of labour (APL) and marginal product of labour (MPL)
Quantity demanded refers to the specific amount of a good or service that consumers are willing and able to purchase at a give price and within a specific time period. Demand, on the other hand, is a broader concept that encompasses the entire relationship between price and quantity demanded
Ezea
ok
Shukri
how do you save a country economic situation when it's falling apart
Economic growth as an increase in the production and consumption of goods and services within an economy.but
Economic development as a broader concept that encompasses not only economic growth but also social & human well being.
Shukri
production function means
Jabir
What do you think is more important to focus on when considering inequality ?
sir...I just want to ask one question... Define the term contract curve? if you are free please help me to find this answer 🙏
Asui
it is a curve that we get after connecting the pareto optimal combinations of two consumers after their mutually beneficial trade offs
Awais
thank you so much 👍 sir
Asui
In economics, the contract curve refers to the set of points in an Edgeworth box diagram where both parties involved in a trade cannot be made better off without making one of them worse off. It represents the Pareto efficient allocations of goods between two individuals or entities, where neither p
Cornelius
In economics, the contract curve refers to the set of points in an Edgeworth box diagram where both parties involved in a trade cannot be made better off without making one of them worse off. It represents the Pareto efficient allocations of goods between two individuals or entities,
Cornelius
Suppose a consumer consuming two commodities X and Y has
The following utility function u=X0.4 Y0.6. If the price of the X and Y are 2 and 3 respectively and income Constraint is birr 50.
A,Calculate quantities of x and y which maximize utility.
B,Calculate value of Lagrange multiplier.
C,Calculate quantities of X and Y consumed with a given price.
D,alculate optimum level of output .