<< Chapter < Page Chapter >> Page >

ACTIVITY 4

To tell expressions and equations apart

[LO 2.1, 2.6]

  • Expressions are combinations of letters ( a , b , x , y , etc), operations (+, –, ×, ) and numbers (1, –5, π, ½ , etc.) as well as brackets and other signs. An expression does not include equal signs.
  • An expression is a little like a word or a phrase – it does not have a verb.
  • Here are some examples: x , x 3 , 5½ , 2πr, 5( ab bc ), 5 a 3 – 3 a 2 + a – 3, 2 a + b size 12{ sqrt {2 left (a+b right )} } {} , 5a 4 2a 2 size 12{ { {5a - 4} over {2a rSup { size 8{2} } } } } {} , etc.
  • An expression can only be manipulated , usually to simplify it. It cannot be solved ; it has no solution . The only way to check your work is do the steps backwards, to see whether you come back to the first step.
  • An equation is two e x pressions with an equal sign in between!
  • It is like a sentence with a verb; it makes a statement. For example 2 x – 3 = 45 says that double a certain number, with three subtracted, is equal to 45. Our job is to find that number.
  • Equations must be solved; they have solutions that can be checked.
  • We do a lot of simplifying while we solve equations, but we do more – we are allowed to do more. Remember we could subtract or add terms, as long as we do it to both sides ! We could multiply or divide by factors, as long as we do it to both sides . Because an expression does not have two sides we can’t do these things to expressions. Be very careful not to mix them up, and practise until you know instinctively what to do.

ACTIVITY 5

To solve two equations simultaneously

[LO 2.4, 2.9]

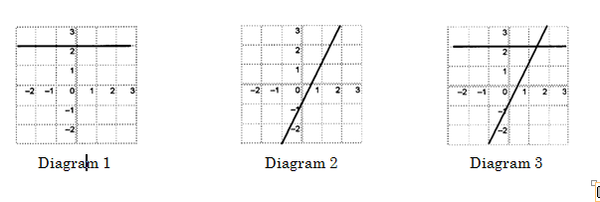
1. The line in figure 1 has defining equation y = 2.

Question: Does the point (1 ; 1) lie on the line?

Answer: We can obtain the answer graphically (by looking at the graph). So we can see that the point does not lie on the line, making the answer no .

We can obtain the answer algebraically , as follows: Substitute the point (1 ; 1) for ( x ; y ) in the equation. Do the LHS and RHS separately as before.

LHS: y = ( 1 ) = 2 RHS: 2 LHS ≠ RHS – the point (1 ; 1) does not lie on y = 2.

Question: Does the point (–2 ; 2) lie on the line?

Graphically : Yes.

Algebraically : LHS: y = ( 2 ) = 2 RHS: 2 LHS = RHS; yes it does.

Question: Does the point (1½ ; 2) lie on the line? Find the answer both graphically and algebraically.

2. The line in figure 2 is defined by the equation y = 2 x – 1.

Questions: Does the point (0 ; 0) lie on the line?

Does the point (1 ; 1) lie on y = 2 x – 1?

Does the point (1½ ; 2) lie on the line?

3. In figure 3 the same two lines are drawn together on the same set of axes.

Answer graphically: Which point lies on both lines? The answers to questions 1 and 2 above will be helpful.

It is easy to see from the graph that the only point that lies on both lines is (1½ ; 2).

  • This can also be determined algebraically:

From the line y = 2 we can see that y has the value 2. If we substitute this value into the equation y = 2 x – 1.

We can solve the equation to get a value for x . So:

Substitute: ( 2 ) = 2 x – 1 and solve for x :

2 = 2 x – 1 now move the x –terms to the left

–2 x + 2 = –1 now move the constant terms to the right

–2 x = –2 – 1 simplify

–2 x = –3 divide both sides by –2

x = –3  –2 simplify

x = 1½

This shows that the point where the lines cross is ( x ; y ) = (1½ ; 2).

Questions & Answers

What is inflation
Bright Reply
a general and ongoing rise in the level of prices in an economy
AI-Robot
What are the factors that affect demand for a commodity
Florence Reply
price
Kenu
differentiate between demand and supply giving examples
Lambiv Reply
differentiated between demand and supply using examples
Lambiv
what is labour ?
Lambiv
how will I do?
Venny Reply
how is the graph works?I don't fully understand
Rezat Reply
information
Eliyee
devaluation
Eliyee
t
WARKISA
hi guys good evening to all
Lambiv
multiple choice question
Aster Reply
appreciation
Eliyee
explain perfect market
Lindiwe Reply
In economics, a perfect market refers to a theoretical construct where all participants have perfect information, goods are homogenous, there are no barriers to entry or exit, and prices are determined solely by supply and demand. It's an idealized model used for analysis,
Ezea
What is ceteris paribus?
Shukri Reply
other things being equal
AI-Robot
When MP₁ becomes negative, TP start to decline. Extuples Suppose that the short-run production function of certain cut-flower firm is given by: Q=4KL-0.6K2 - 0.112 • Where is quantity of cut flower produced, I is labour input and K is fixed capital input (K-5). Determine the average product of lab
Kelo
Extuples Suppose that the short-run production function of certain cut-flower firm is given by: Q=4KL-0.6K2 - 0.112 • Where is quantity of cut flower produced, I is labour input and K is fixed capital input (K-5). Determine the average product of labour (APL) and marginal product of labour (MPL)
Kelo
yes,thank you
Shukri
Can I ask you other question?
Shukri
what is monopoly mean?
Habtamu Reply
What is different between quantity demand and demand?
Shukri Reply
Quantity demanded refers to the specific amount of a good or service that consumers are willing and able to purchase at a give price and within a specific time period. Demand, on the other hand, is a broader concept that encompasses the entire relationship between price and quantity demanded
Ezea
ok
Shukri
how do you save a country economic situation when it's falling apart
Lilia Reply
what is the difference between economic growth and development
Fiker Reply
Economic growth as an increase in the production and consumption of goods and services within an economy.but Economic development as a broader concept that encompasses not only economic growth but also social & human well being.
Shukri
production function means
Jabir
What do you think is more important to focus on when considering inequality ?
Abdisa Reply
any question about economics?
Awais Reply
sir...I just want to ask one question... Define the term contract curve? if you are free please help me to find this answer 🙏
Asui
it is a curve that we get after connecting the pareto optimal combinations of two consumers after their mutually beneficial trade offs
Awais
thank you so much 👍 sir
Asui
In economics, the contract curve refers to the set of points in an Edgeworth box diagram where both parties involved in a trade cannot be made better off without making one of them worse off. It represents the Pareto efficient allocations of goods between two individuals or entities, where neither p
Cornelius
In economics, the contract curve refers to the set of points in an Edgeworth box diagram where both parties involved in a trade cannot be made better off without making one of them worse off. It represents the Pareto efficient allocations of goods between two individuals or entities,
Cornelius
Suppose a consumer consuming two commodities X and Y has The following utility function u=X0.4 Y0.6. If the price of the X and Y are 2 and 3 respectively and income Constraint is birr 50. A,Calculate quantities of x and y which maximize utility. B,Calculate value of Lagrange multiplier. C,Calculate quantities of X and Y consumed with a given price. D,alculate optimum level of output .
Feyisa Reply
Answer
Feyisa
c
Jabir
Got questions? Join the online conversation and get instant answers!
Jobilize.com Reply

Get Jobilize Job Search Mobile App in your pocket Now!

Get it on Google Play Download on the App Store Now


Source:  OpenStax, Mathematics grade 9. OpenStax CNX. Sep 14, 2009 Download for free at http://cnx.org/content/col11056/1.1
Google Play and the Google Play logo are trademarks of Google Inc.

Notification Switch

Would you like to follow the 'Mathematics grade 9' conversation and receive update notifications?

Ask