

| << Chapter < Page | Chapter >> Page > |
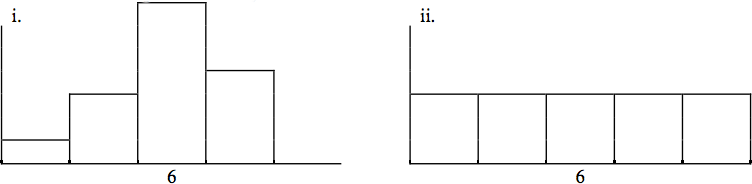
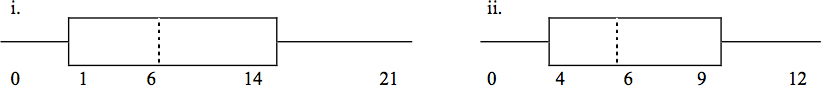
Javier and Ercilia are supervisors at a shopping mall. Each was given the task of estimating the mean distance that shoppers live from the mall. They each randomly surveyed 100 shoppers. The samples yielded the following information:
| Javier | Ercilla | |
|---|---|---|
| 6.0 miles | 6.0 miles | |
| 4.0 miles | 7.0 miles |
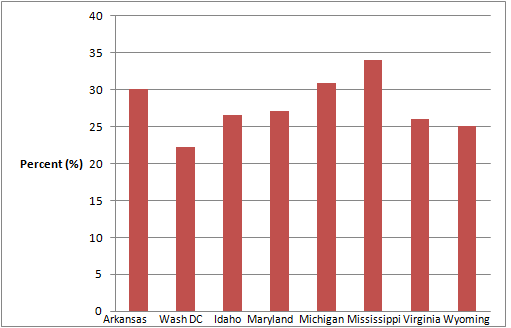
Below are the 2010 obesity rates by U.S. states and Washington, DC. ( Source: http://www.cdc.gov/obesity/data/adult.html) )
| State | Percent (%) | State | Percent (%) |
|---|---|---|---|
| Alabama | 32.2 | Montana | 23.0 |
| Alaska | 24.5 | Nebraska | 26.9 |
| Arizona | 24.3 | Nevada | 22.4 |
| Arkansas | 30.1 | New Hampshire | 25.0 |
| California | 24.0 | New Jersey | 23.8 |
| Colorado | 21.0 | New Mexico | 25.1 |
| Connecticut | 22.5 | New York | 23.9 |
| Delaware | 28.0 | North Carolina | 27.8 |
| Washington, DC | 22.2 | North Dakota | 27.2 |
| Florida | 26.6 | Ohio | 29.2 |
| Georgia | 29.6 | Oklahoma | 30.4 |
| Hawaii | 22.7 | Oregon | 26.8 |
| Idaho | 26.5 | Pennsylvania | 28.6 |
| Illinois | 28.2 | Rhode Island | 25.5 |
| Indiana | 29.6 | South Carolina | 31.5 |
| Iowa | 28.4 | South Dakota | 27.3 |
| Kansas | 29.4 | Tennessee | 30.8 |
| Kentucky | 31.3 | Texas | 31.0 |
| Louisiana | 31.0 | Utah | 22.5 |
| Maine | 26.8 | Vermont | 23.2 |
| Maryland | 27.1 | Virginia | 26.0 |
| Massachusetts | 23.0 | Washington | 25.5 |
| Michigan | 30.9 | West Virginia | 32.5 |
| Minnesota | 24.8 | Wisconsin | 26.3 |
| Mississippi | 34.0 | Wyoming | 25.1 |
| Missouri | 30.5 |
Example solution for b using the random number generator for the Ti-84 Plus to generate a simple random sample of 8 states. Instructions are below.
A music school has budgeted to purchase 3 musical instruments. They plan to purchase a piano costing $3000, a guitar costing $550, and a drum set costing $600. The mean cost for a piano is $4,000 with a standard deviation of $2,500. The mean cost for a guitar is $500 with a standard deviation of $200. The mean cost for drums is $700 with a standard deviation of $100. Which cost is the lowest, when compared to other instruments of the same type? Which cost is the highest when compared to other instruments of the same type. Justify your answer numerically.
For pianos, the cost of the piano is 0.4 standard deviations BELOW the mean. For guitars, the cost of the guitar is 0.25 standard deviations ABOVE the mean. For drums, the cost of the drum set is 1.0 standard deviations BELOW the mean. Of the three, the drums cost the lowest in comparison to the cost of other instruments of the same type. The guitar cost the most in comparison to the cost of other instruments of the same type.
Notification Switch
Would you like to follow the 'Collaborative statistics using spreadsheets' conversation and receive update notifications?

|
|

|
|

|
|

|
|

|
|

|
|

|
|

|
|

|
|

|