<< Chapter < Page Chapter >> Page >

Genomic- and proteomic-scale analyses are part of systems biology. Systems biology is the study of whole biological systems (genomes and proteomes) based on interactions within the system. The European Bioinformatics Institute and the Human Proteome Organization (HUPO) are developing and establishing effective tools to sort through the enormous pile of systems biology data. Because proteins are the direct products of genes and reflect activity at the genomic level, it is natural to use proteomes to compare the protein profiles of different cells to identify proteins and genes involved in disease processes. Most pharmaceutical drug trials target proteins. Information obtained from proteomics is being used to identify novel drugs and understand their mechanisms of action.
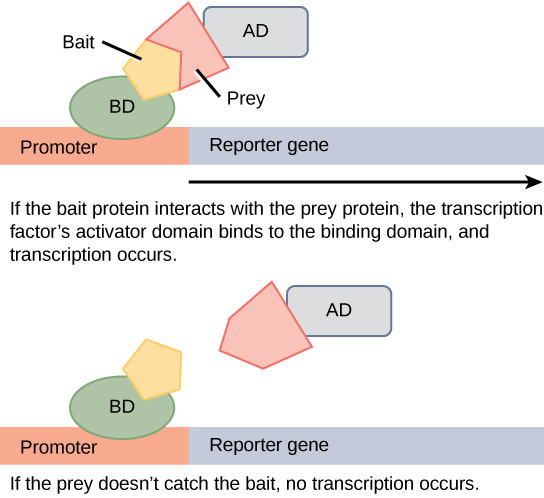
In two-hybrid screening, the binding domain of a transcription factor is separated from the activator domain. A bait protein is attached to the DNA-binding domain of a transcription factor, and a prey protein is attached to the activator domain. If the prey catches the bait (in other words, binds to it), transcription of a reporter gene occurs. If the prey does not catch the bait, no transcription occurs. Scientists use this transcriptional activation to determine if interaction between the bait and prey has occurred.
Two-hybrid screening is used to determine whether two proteins interact. In this method, a transcription factor is split into a DNA-binding domain (BD) and an activator domain (AD). The binding domain is able to bind the promoter in the absence of the activator domain, but it does not turn on transcription. A protein called the bait is attached to the BD, and a protein called the prey is attached to the AD. Transcription occurs only if the prey “catches” the bait.

The challenge of techniques used for proteomic analyses is the difficulty in detecting small quantities of proteins. Although mass spectrometry is good for detecting small amounts of proteins, variations in protein expression in diseased states can be difficult to discern. Proteins are naturally unstable molecules, which makes proteomic analysis much more difficult than genomic analysis.

Cancer proteomics

Genomes and proteomes of patients suffering from specific diseases are being studied to understand the genetic basis of the disease. The most prominent disease being studied with proteomic approaches is cancer. Proteomic approaches are being used to improve screening and early detection of cancer; this is achieved by identifying proteins whose expression is affected by the disease process. An individual protein is called a biomarker    , whereas a set of proteins with altered expression levels is called a protein signature    . For a biomarker or protein signature to be useful as a candidate for early screening and detection of a cancer, it must be secreted in body fluids, such as sweat, blood, or urine, such that large-scale screenings can be performed in a non-invasive fashion. The current problem with using biomarkers for the early detection of cancer is the high rate of false-negative results. A false negative    is an incorrect test result that should have been positive. In other words, many cases of cancer go undetected, which makes biomarkers unreliable. Some examples of protein biomarkers used in cancer detection are CA-125 for ovarian cancer and PSA for prostate cancer. Protein signatures may be more reliable than biomarkers to detect cancer cells. Proteomics is also being used to develop individualized treatment plans, which involves the prediction of whether or not an individual will respond to specific drugs and the side effects that the individual may experience. Proteomics is also being used to predict the possibility of disease recurrence.

The National Cancer Institute has developed programs to improve the detection and treatment of cancer. The Clinical Proteomic Technologies for Cancer and the Early Detection Research Network are efforts to identify protein signatures specific to different types of cancers. The Biomedical Proteomics Program is designed to identify protein signatures and design effective therapies for cancer patients.

Section summary

Proteomics is the study of the entire set of proteins expressed by a given type of cell under certain environmental conditions. In a multicellular organism, different cell types will have different proteomes, and these will vary with changes in the environment. Unlike a genome, a proteome is dynamic and in constant flux, which makes it both more complicated and more useful than the knowledge of genomes alone.

Proteomics approaches rely on protein analysis; these techniques are constantly being upgraded. Proteomics has been used to study different types of cancer. Different biomarkers and protein signatures are being used to analyze each type of cancer. The future goal is to have a personalized treatment plan for each individual.

Questions & Answers

What is inflation
Bright Reply
a general and ongoing rise in the level of prices in an economy
AI-Robot
What are the factors that affect demand for a commodity
Florence Reply
price
Kenu
differentiate between demand and supply giving examples
Lambiv Reply
differentiated between demand and supply using examples
Lambiv
what is labour ?
Lambiv
how will I do?
Venny Reply
how is the graph works?I don't fully understand
Rezat Reply
information
Eliyee
devaluation
Eliyee
t
WARKISA
hi guys good evening to all
Lambiv
multiple choice question
Aster Reply
appreciation
Eliyee
explain perfect market
Lindiwe Reply
In economics, a perfect market refers to a theoretical construct where all participants have perfect information, goods are homogenous, there are no barriers to entry or exit, and prices are determined solely by supply and demand. It's an idealized model used for analysis,
Ezea
What is ceteris paribus?
Shukri Reply
other things being equal
AI-Robot
When MP₁ becomes negative, TP start to decline. Extuples Suppose that the short-run production function of certain cut-flower firm is given by: Q=4KL-0.6K2 - 0.112 • Where is quantity of cut flower produced, I is labour input and K is fixed capital input (K-5). Determine the average product of lab
Kelo
Extuples Suppose that the short-run production function of certain cut-flower firm is given by: Q=4KL-0.6K2 - 0.112 • Where is quantity of cut flower produced, I is labour input and K is fixed capital input (K-5). Determine the average product of labour (APL) and marginal product of labour (MPL)
Kelo
yes,thank you
Shukri
Can I ask you other question?
Shukri
what is monopoly mean?
Habtamu Reply
What is different between quantity demand and demand?
Shukri Reply
Quantity demanded refers to the specific amount of a good or service that consumers are willing and able to purchase at a give price and within a specific time period. Demand, on the other hand, is a broader concept that encompasses the entire relationship between price and quantity demanded
Ezea
ok
Shukri
how do you save a country economic situation when it's falling apart
Lilia Reply
what is the difference between economic growth and development
Fiker Reply
Economic growth as an increase in the production and consumption of goods and services within an economy.but Economic development as a broader concept that encompasses not only economic growth but also social & human well being.
Shukri
production function means
Jabir
What do you think is more important to focus on when considering inequality ?
Abdisa Reply
any question about economics?
Awais Reply
sir...I just want to ask one question... Define the term contract curve? if you are free please help me to find this answer 🙏
Asui
it is a curve that we get after connecting the pareto optimal combinations of two consumers after their mutually beneficial trade offs
Awais
thank you so much 👍 sir
Asui
In economics, the contract curve refers to the set of points in an Edgeworth box diagram where both parties involved in a trade cannot be made better off without making one of them worse off. It represents the Pareto efficient allocations of goods between two individuals or entities, where neither p
Cornelius
In economics, the contract curve refers to the set of points in an Edgeworth box diagram where both parties involved in a trade cannot be made better off without making one of them worse off. It represents the Pareto efficient allocations of goods between two individuals or entities,
Cornelius
Suppose a consumer consuming two commodities X and Y has The following utility function u=X0.4 Y0.6. If the price of the X and Y are 2 and 3 respectively and income Constraint is birr 50. A,Calculate quantities of x and y which maximize utility. B,Calculate value of Lagrange multiplier. C,Calculate quantities of X and Y consumed with a given price. D,alculate optimum level of output .
Feyisa Reply
Answer
Feyisa
c
Jabir
Got questions? Join the online conversation and get instant answers!
Jobilize.com Reply

Get Jobilize Job Search Mobile App in your pocket Now!

Get it on Google Play Download on the App Store Now


Source:  OpenStax, General biology i lecture. OpenStax CNX. Aug 25, 2015 Download for free at https://legacy.cnx.org/content/col11869/1.1
Google Play and the Google Play logo are trademarks of Google Inc.

Notification Switch

Would you like to follow the 'General biology i lecture' conversation and receive update notifications?

Ask