<< Chapter < Page Chapter >> Page >

Geography

Grade 5

Climate and vegetation regions of south africa

Module 12

The climate of south africa: temperature

1. The topography of South Africa

  • Because the relief of a country has a major influence on the climate of the country, we must refer to it again briefly. For more information you can return to the modules on South Africa’s physical structure.
  • If you study any natural map in an atlas, it will become clear that our country lies at varying heights above sea level (altitudes). A cross-profile of the topography of the RSA looks more or less like an inverted saucer.

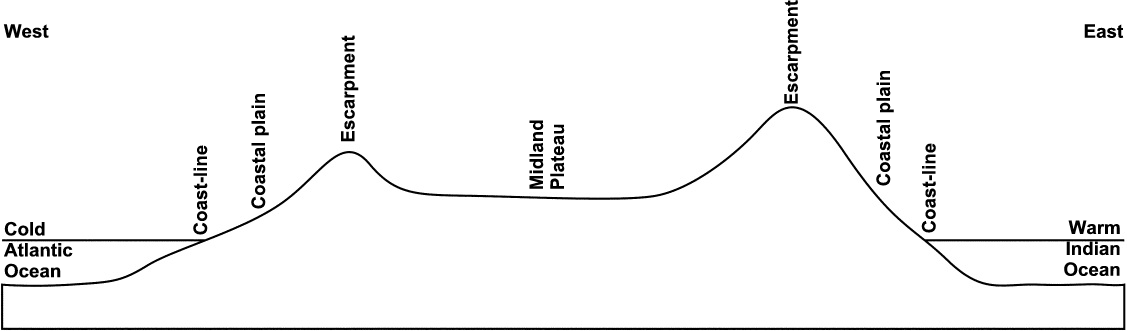
Figure 1: A cross-profile of the RSA

  • The largest part of South Africa lies high above sea level. A warm sea-current flows along the east coast and a cold sea-current along the west coast. The high mountains along the coast cut off the midland plateau. These factors strongly influence the climate of the country.

2. Factors affecting South Africa’s climate

T emperature

South Africa displays typical temperature patterns during different seasons. Few people plan a holiday on the west coast in winter, while Durban (south-east coast) has ideal holiday temperatures during winter.

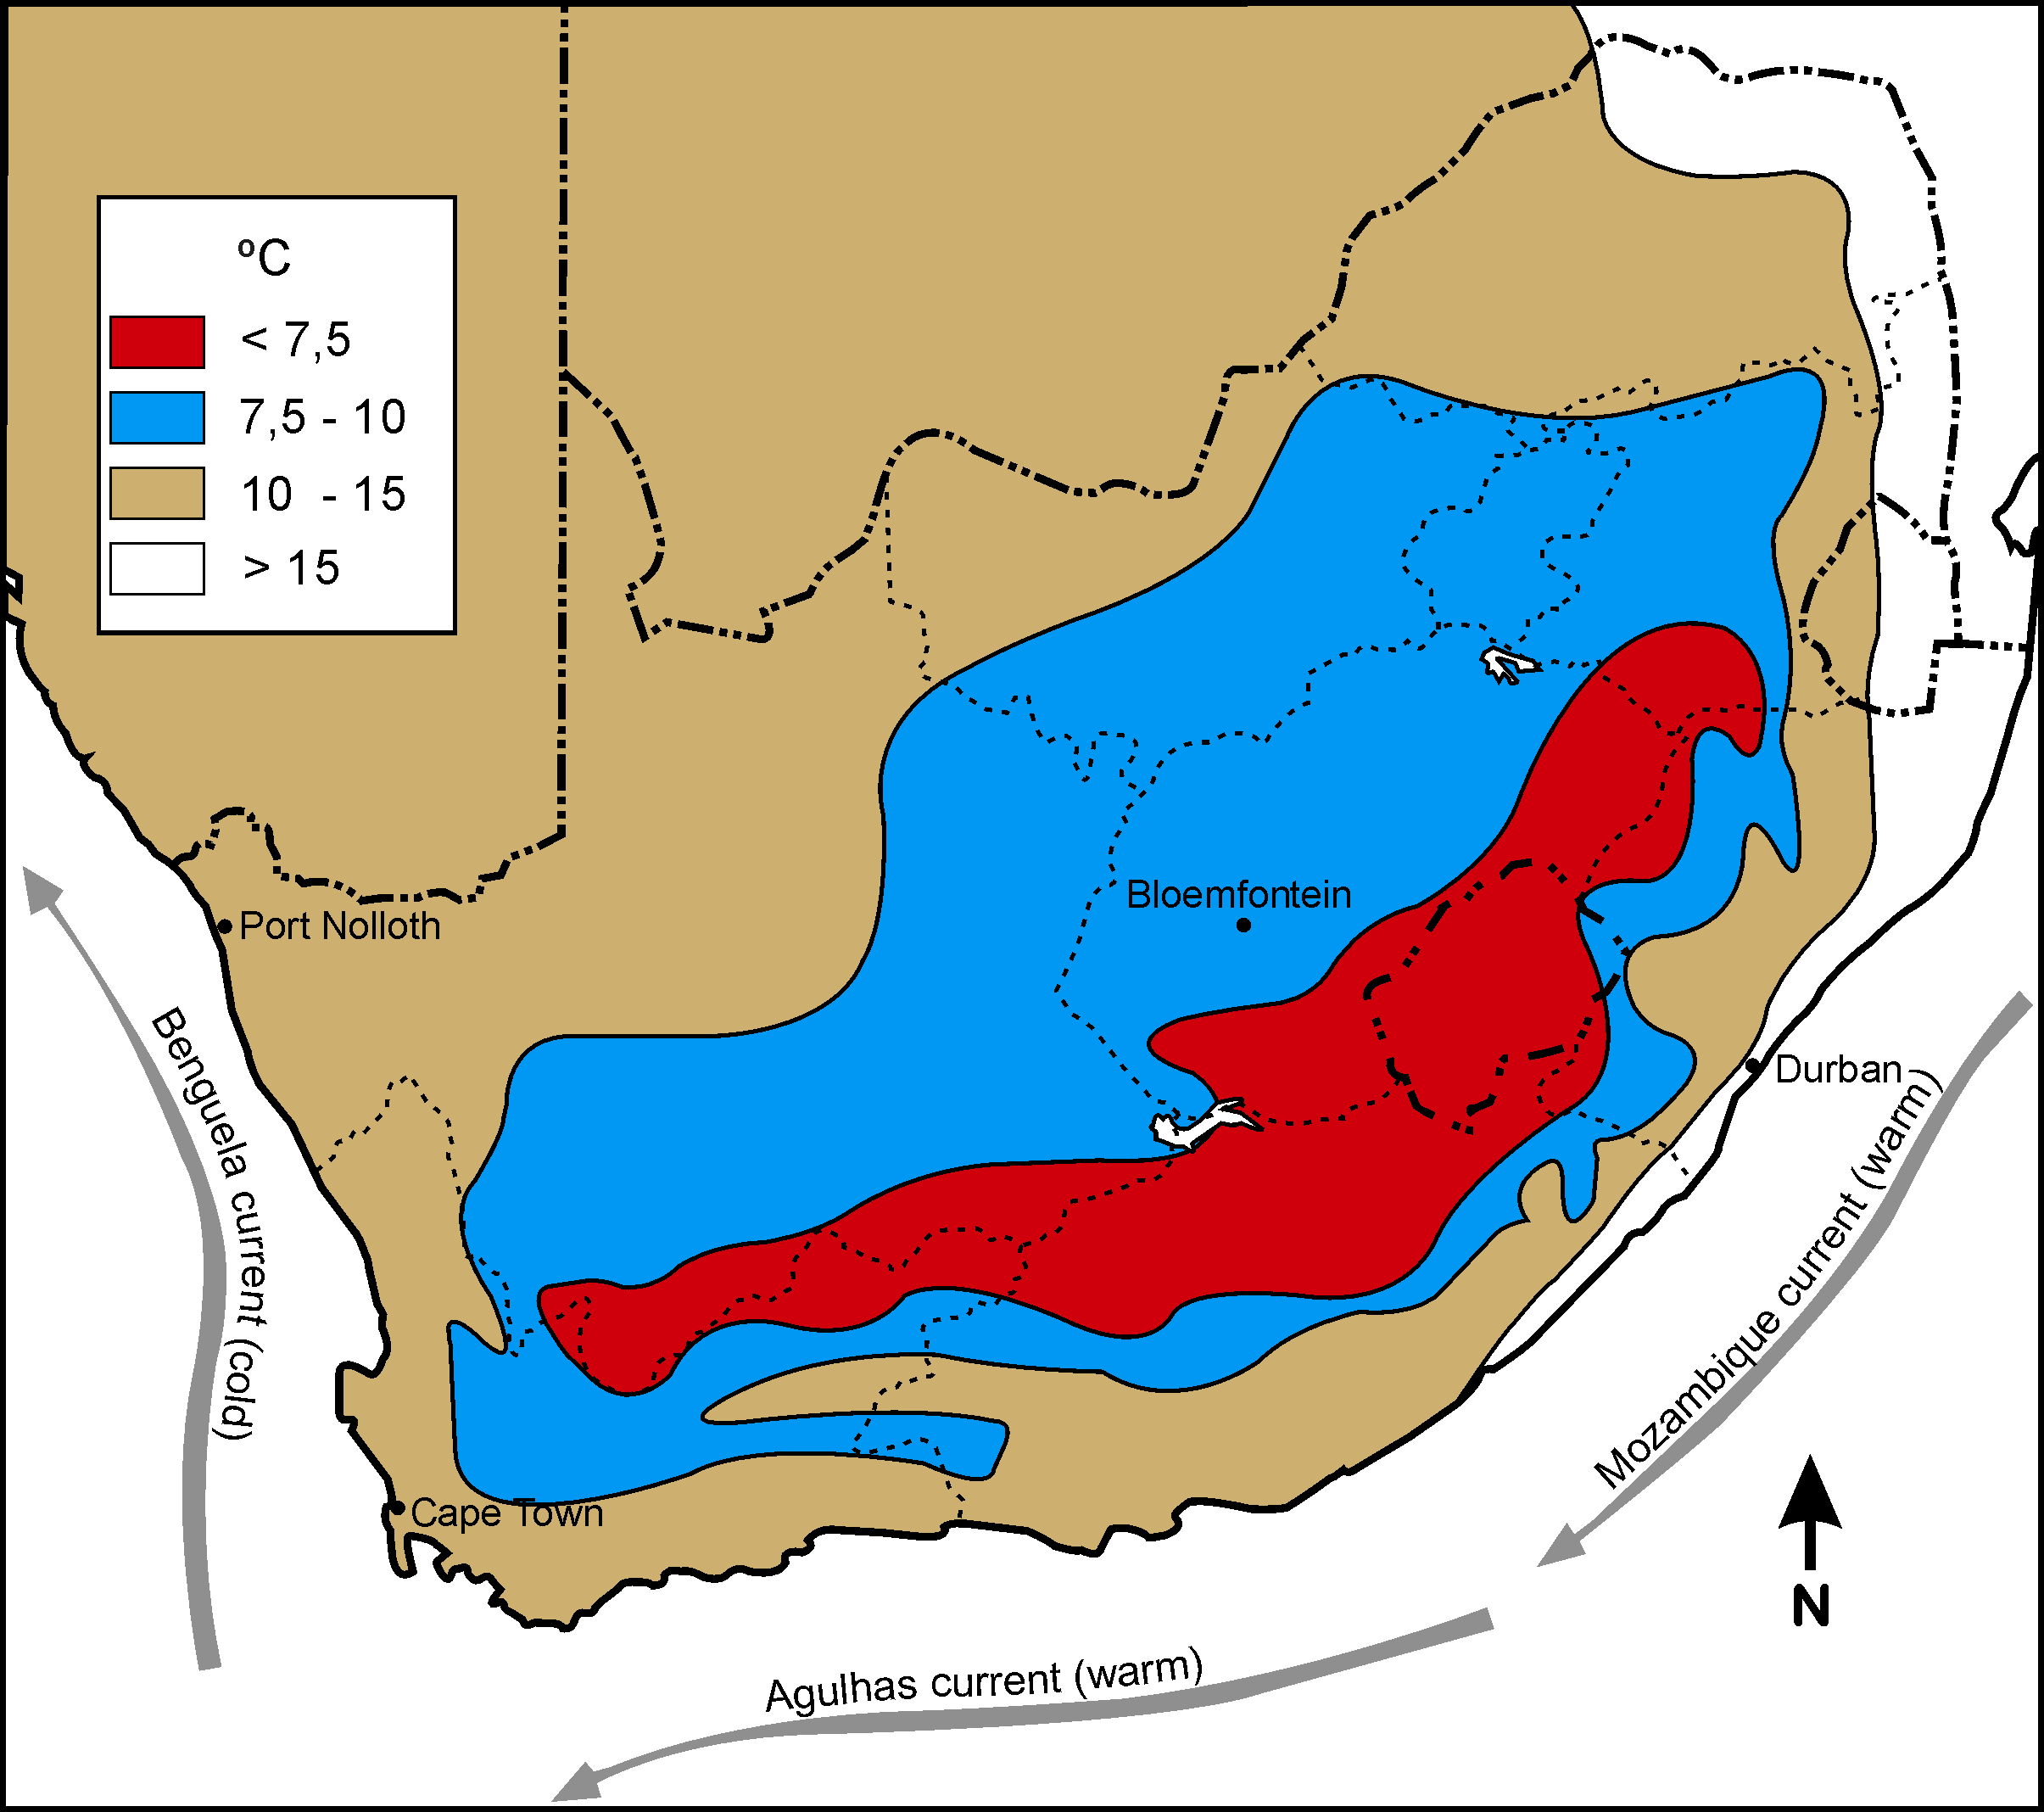
Winter temperature in South Africa
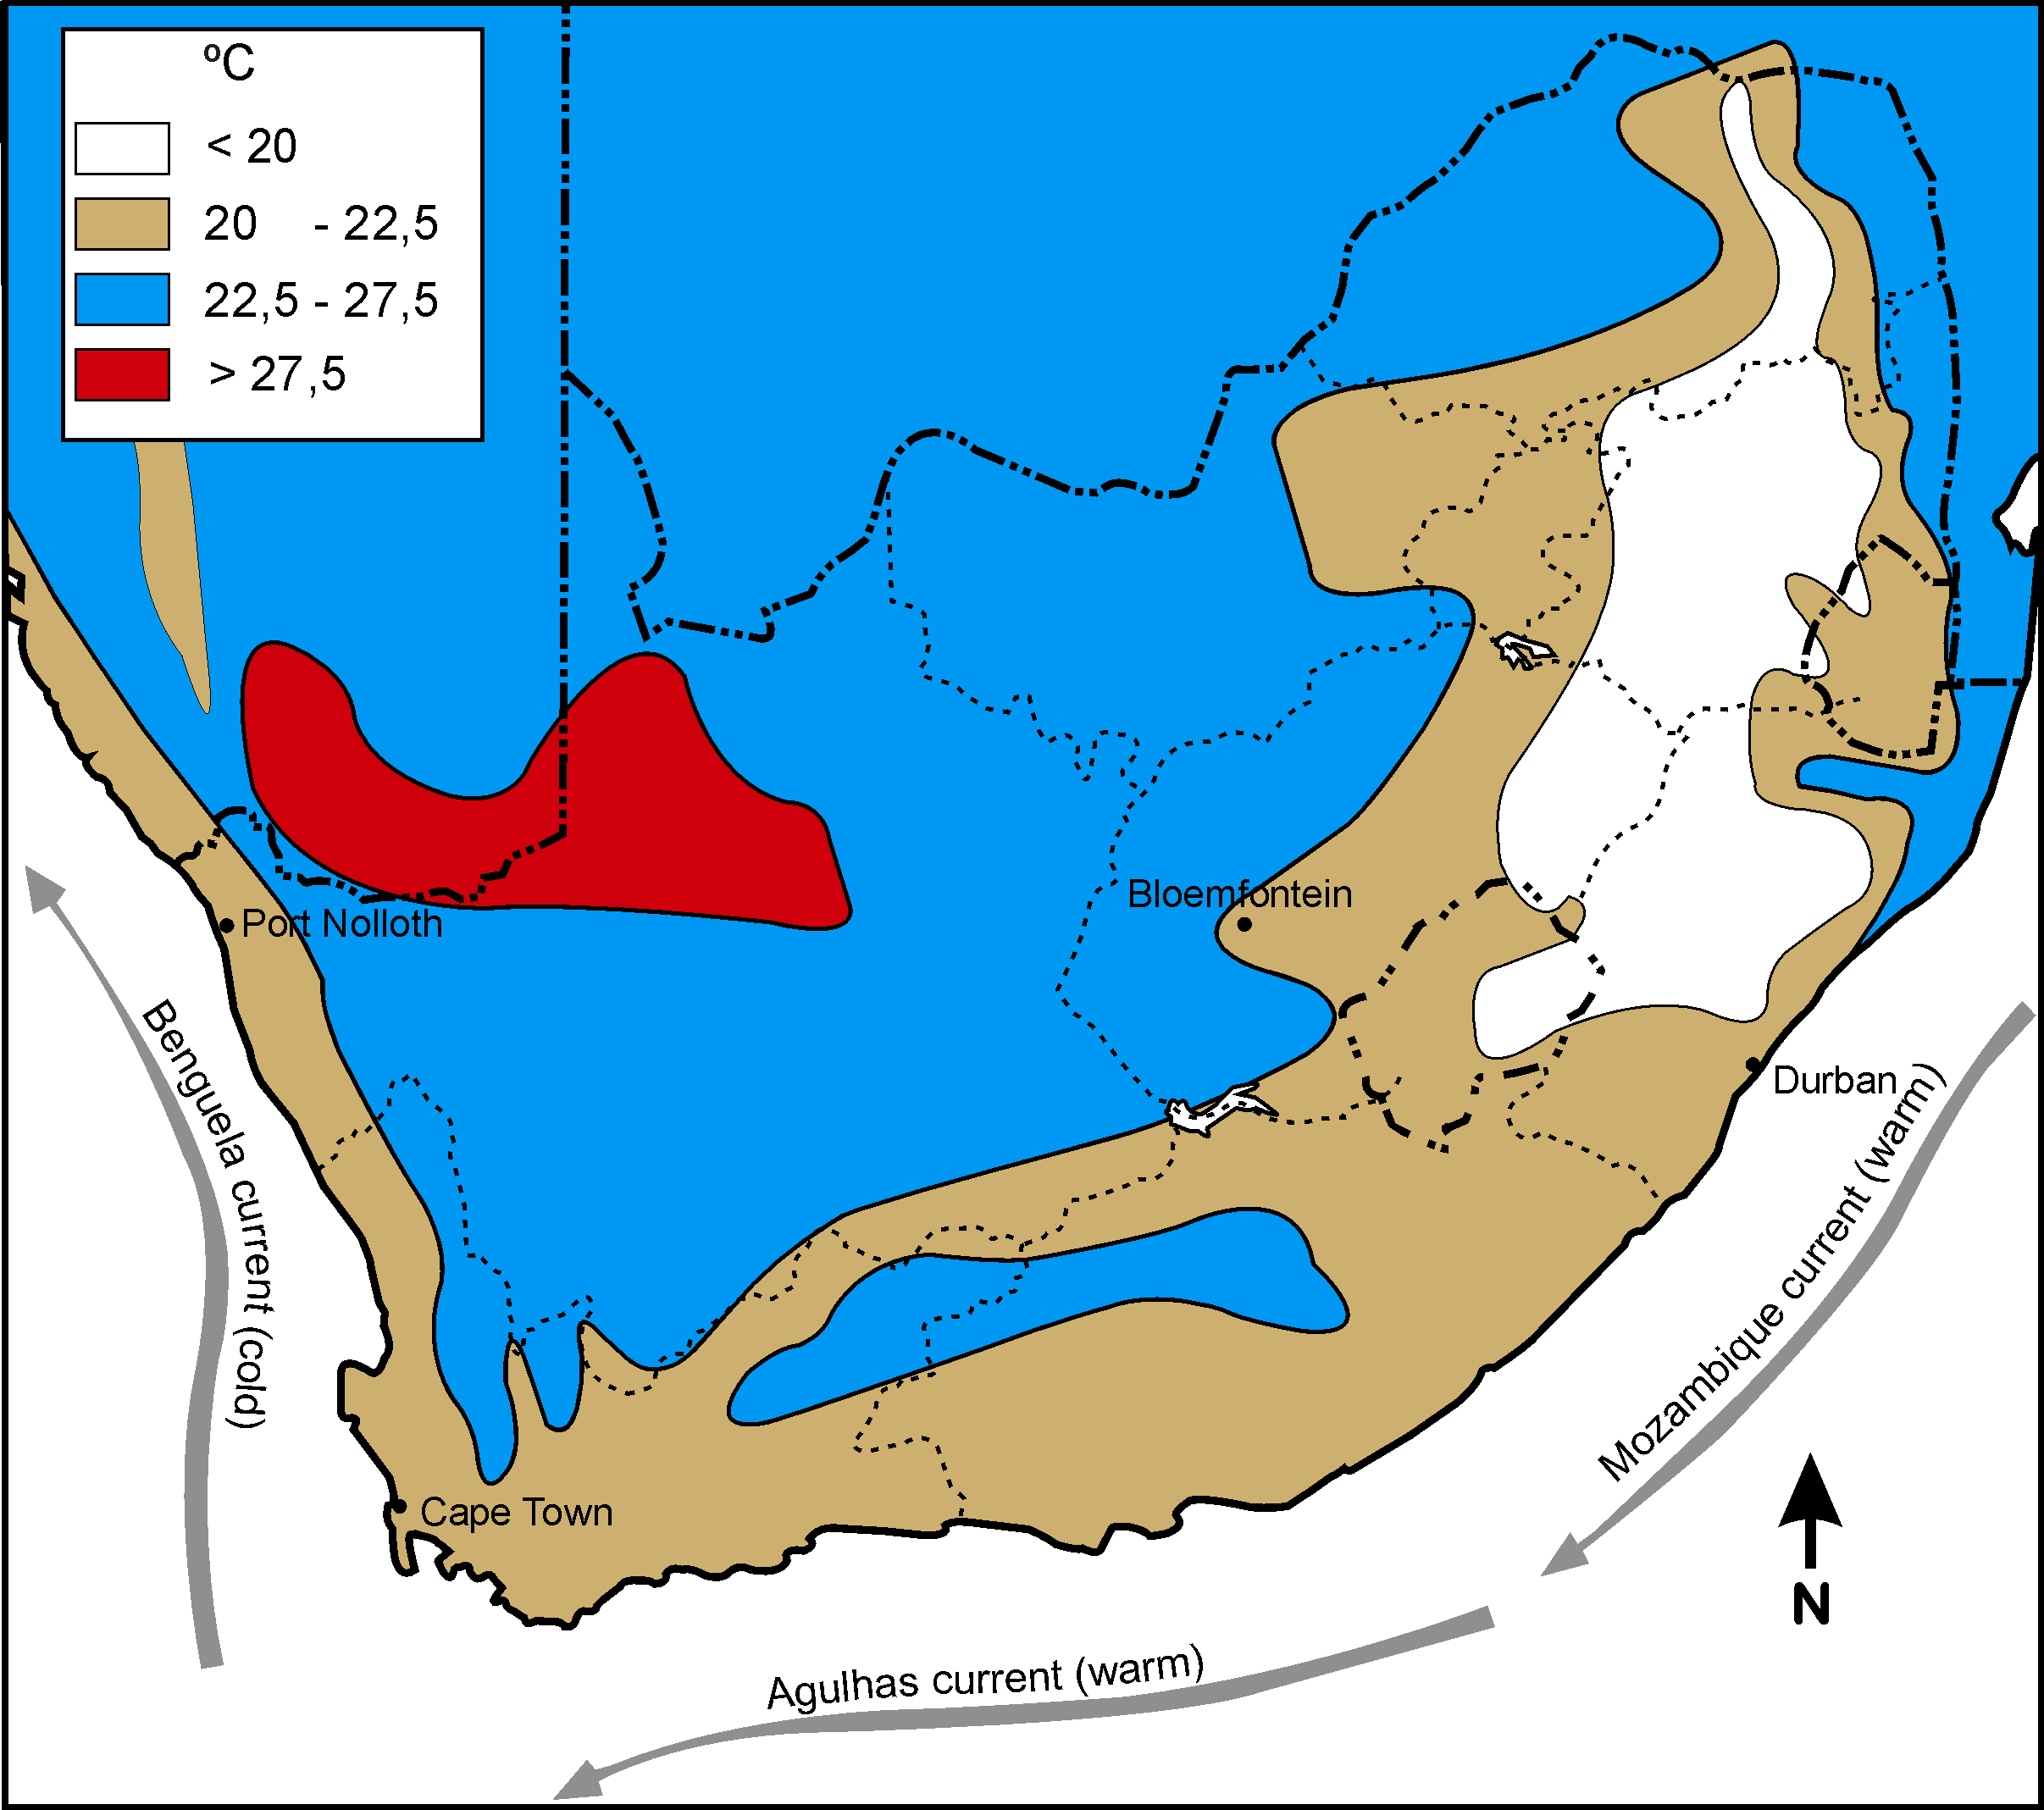
Summer temperature in South Africa

The temperature of the RSA is influenced by the following:

Latitude location

The further a region is located from the Equator (0º L), the colder it is. Places in the tropics therefore experience warmer temperatures than places at the poles.

Altitude

The higher you go above sea level, the colder it becomes. Temperature therefore drops as altitude increases. Because the RSA’s interior plateau is located high above sea level, it will be colder there than in parts along lower coastal areas. Frost is common on the interior plateau and snow occurs on the high mountains.

Sea currents

The warm Mozambique current flows southwest along the RSA’s east coast, and the cold Benguela current flows north along the west coast. Air above a cold current is cold and there is little chance of rain. With a warm current the air is warm, rises, condenses and clouds and rain occur.

Distance from the sea

The sea has a moderating effect on climate. This means that areas that are close to the sea are not too hot in summer and not too cold in winter. The temperature margin is therefore small (difference between the highest and lowest temperatures). The reason for this is that water masses are not heated as quickly through insulation as the land surfaces. However, once water has absorbed heat, it retains it for longer than land surfaces. During the day radiation of heat from the soil is high, but it is low at night.

During the day the radiation from the sea’s water is less and this results in lower temperatures than in the case of the interior. At night the earth radiates heat for longer and the coastal areas are therefore warmer at night than the interior. Use this information to do the following activities.

Activity 1:

To study the line graphs and answer the questions

[lo 1.1;1.7]

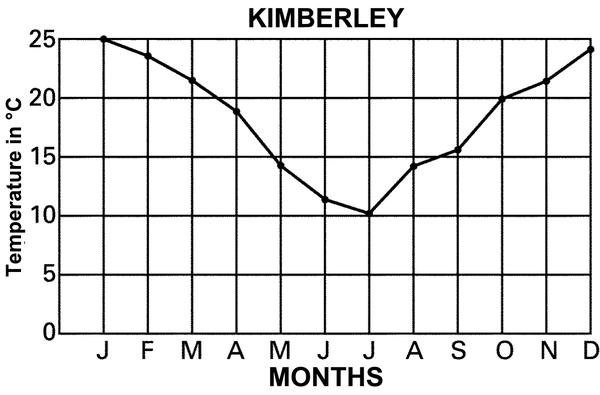
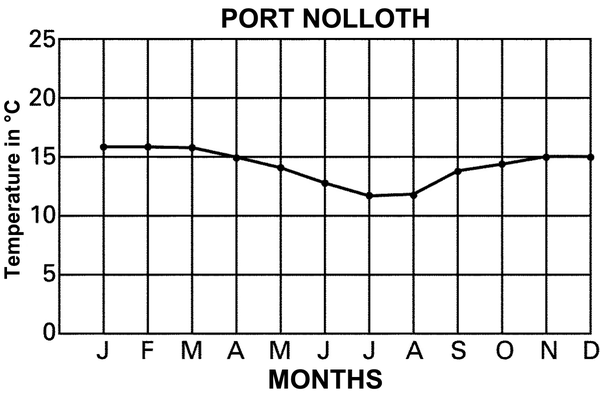
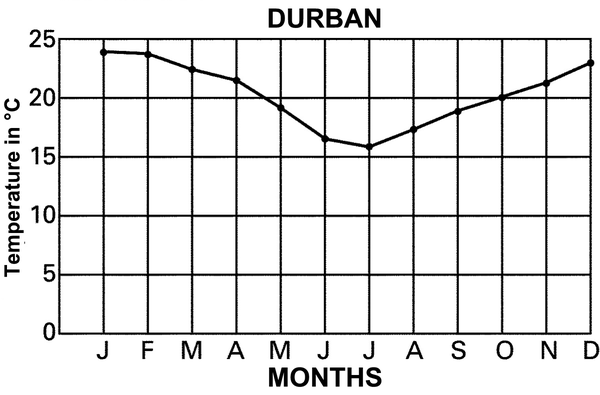
Explain why the day and night temperatures in Kimberley differ much more than those in Port Nolloth and Durban.

Why is Durban’s temperature higher than that of Port Nolloth? Use your atlas to find the places if you are unsure.

Activity 2:

To draw a line graph of the temperatures of bloemfontein and cape town

[lo 1.7]

Study the following temperatures. Find the location of the various places in an atlas if you do not know where they are located. Remember the labels and headings.

Months Jan Feb Mar Apr May Jun Jul Aug Sept Oct Nov Dec
Bloem-fontein24°S;1 400 mabove sea level 23 22 20 16 11 9 8 11 15 18 20 22
Cape Town34°S; sea level 22 22 20 18 15 14 13 14 15 17 19 20

For each place in the above table indicate the following:

  • the highest monthly temperature
  • the lowest monthly temperature
  • the temperature margin (difference between highest and lowest temperatures)
  • the average temperature

Explain the difference in temperature between the following places by referring to the factors that affect the climate of South Africa

  • Port Nolloth and Bloemfontein
  • Bloemfontein and Cape Town

Assessment

LO 1

GEOGRAPHICAL ENQUIRY

The learner will be able to use enquiry skills to investigate geographical and environmental concepts and processes.

We know this when the learner:

1.1 with guidance, selects and uses sources of useful geographical information (including graphs, maps and fieldwork outside the classroom) [finds sources];

  • distinguishes between facts and opinions [works with sources];
  • categorises information [works with sources];
  • draws sketch maps and/or plans from field observation and measurements [works with sources];

1.7 demonstrates knowledge and under-standing of the issue through projects, discussion, debate and charts [communicates the answer].

Memorandum

  • Interior – far from the temperate influence of the ocean
  • On a plateau – low winter temperature
  • Warm ocean current

Questions & Answers

What is inflation
Bright Reply
a general and ongoing rise in the level of prices in an economy
AI-Robot
What are the factors that affect demand for a commodity
Florence Reply
price
Kenu
differentiate between demand and supply giving examples
Lambiv Reply
differentiated between demand and supply using examples
Lambiv
what is labour ?
Lambiv
how will I do?
Venny Reply
how is the graph works?I don't fully understand
Rezat Reply
information
Eliyee
devaluation
Eliyee
t
WARKISA
hi guys good evening to all
Lambiv
multiple choice question
Aster Reply
appreciation
Eliyee
explain perfect market
Lindiwe Reply
In economics, a perfect market refers to a theoretical construct where all participants have perfect information, goods are homogenous, there are no barriers to entry or exit, and prices are determined solely by supply and demand. It's an idealized model used for analysis,
Ezea
What is ceteris paribus?
Shukri Reply
other things being equal
AI-Robot
When MP₁ becomes negative, TP start to decline. Extuples Suppose that the short-run production function of certain cut-flower firm is given by: Q=4KL-0.6K2 - 0.112 • Where is quantity of cut flower produced, I is labour input and K is fixed capital input (K-5). Determine the average product of lab
Kelo
Extuples Suppose that the short-run production function of certain cut-flower firm is given by: Q=4KL-0.6K2 - 0.112 • Where is quantity of cut flower produced, I is labour input and K is fixed capital input (K-5). Determine the average product of labour (APL) and marginal product of labour (MPL)
Kelo
yes,thank you
Shukri
Can I ask you other question?
Shukri
what is monopoly mean?
Habtamu Reply
What is different between quantity demand and demand?
Shukri Reply
Quantity demanded refers to the specific amount of a good or service that consumers are willing and able to purchase at a give price and within a specific time period. Demand, on the other hand, is a broader concept that encompasses the entire relationship between price and quantity demanded
Ezea
ok
Shukri
how do you save a country economic situation when it's falling apart
Lilia Reply
what is the difference between economic growth and development
Fiker Reply
Economic growth as an increase in the production and consumption of goods and services within an economy.but Economic development as a broader concept that encompasses not only economic growth but also social & human well being.
Shukri
production function means
Jabir
What do you think is more important to focus on when considering inequality ?
Abdisa Reply
any question about economics?
Awais Reply
sir...I just want to ask one question... Define the term contract curve? if you are free please help me to find this answer 🙏
Asui
it is a curve that we get after connecting the pareto optimal combinations of two consumers after their mutually beneficial trade offs
Awais
thank you so much 👍 sir
Asui
In economics, the contract curve refers to the set of points in an Edgeworth box diagram where both parties involved in a trade cannot be made better off without making one of them worse off. It represents the Pareto efficient allocations of goods between two individuals or entities, where neither p
Cornelius
In economics, the contract curve refers to the set of points in an Edgeworth box diagram where both parties involved in a trade cannot be made better off without making one of them worse off. It represents the Pareto efficient allocations of goods between two individuals or entities,
Cornelius
Suppose a consumer consuming two commodities X and Y has The following utility function u=X0.4 Y0.6. If the price of the X and Y are 2 and 3 respectively and income Constraint is birr 50. A,Calculate quantities of x and y which maximize utility. B,Calculate value of Lagrange multiplier. C,Calculate quantities of X and Y consumed with a given price. D,alculate optimum level of output .
Feyisa Reply
Answer
Feyisa
c
Jabir
Got questions? Join the online conversation and get instant answers!
Jobilize.com Reply

Get Jobilize Job Search Mobile App in your pocket Now!

Get it on Google Play Download on the App Store Now


Source:  OpenStax, Social sciences: geography grade 5. OpenStax CNX. Sep 23, 2009 Download for free at http://cnx.org/content/col10986/1.2
Google Play and the Google Play logo are trademarks of Google Inc.

Notification Switch

Would you like to follow the 'Social sciences: geography grade 5' conversation and receive update notifications?

Ask