This module is from Elementary Algebra</link>by Denny Burzynski and Wade Ellis, Jr.
Methods of solving quadratic equations as well as the logic underlying each method are discussed. Factoring, extraction of roots, completing the square, and the quadratic formula are carefully developed. The zero-factor property of real numbers is reintroduced. The chapter also includes graphs of quadratic equations based on the standard parabola, y = x^2, and applied problems from the areas of manufacturing, population, physics, geometry, mathematics (numbers and volumes), and astronomy, which are solved using the five-step method.Objectives of this module: be able to construct the graph of a parabola.
Overview
- Parabolas
- Constructing Graphs of Parabolas
Parabolas
We will now study the graphs of quadratic equations in two variables with general form
Parabola
All such graphs have a similar shape. The graph of a quadratic equation of this type Parabola is called a
parabola and it will assume one of the following shapes.
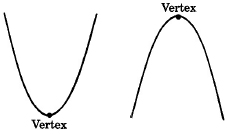
Vertex
The high point or low point of a parabola is called the
vertex of the parabola.
Constructing graphs of parabolas
We will construct the graph of a parabola by choosing several
-values, computing to find the corresponding
-values, plotting these ordered pairs, then drawing a smooth curve through them.
Sample set a
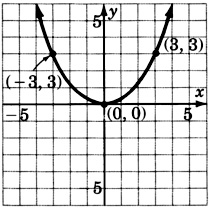
Graph
Construct a table to exhibit several ordered pairs.
|
|
|
| 0 |
0 |
| 1 |
1 |
| 2 |
4 |
| 3 |
9 |
|
|
1 |
|
|
4 |
|
|
9 |
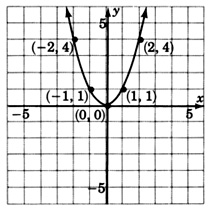
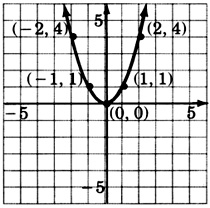
This is the most basic parabola. Although other parabolas may be wider, narrower, moved up or down, moved to the left or right, or inverted, they will all have this same basic shape. We will need to plot as many ordered pairs as necessary to ensure this basic shape.
Got questions? Get instant answers now!
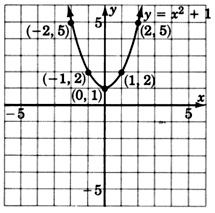
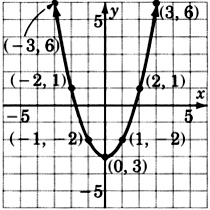
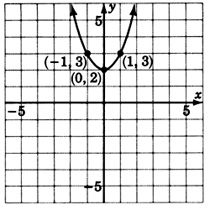
Graph
Construct a table of ordered pairs.
|
|
|
| 0 |
|
| 1 |
|
| 2 |
2 |
| 3 |
7 |
|
|
|
|
|
2 |
|
|
7 |
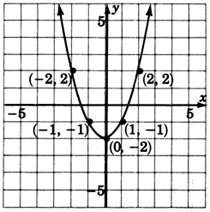
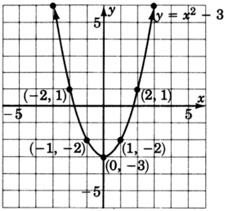
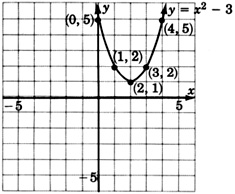
Notice that the graph of
is precisely the graph of
but translated 2 units down. Compare the equations
and
. Do you see what causes the 2 unit downward translation?
Got questions? Get instant answers now!
Practice set a
Sample set b
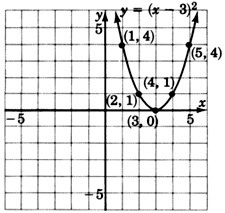
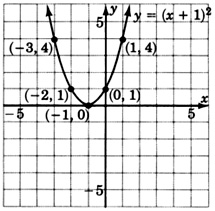
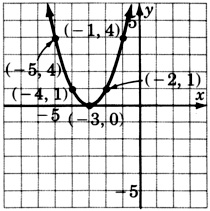
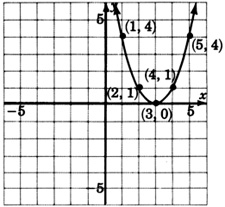
Graph
Do we expect the graph to be similar to the graph of
? Make a table of ordered pairs.
|
|
|
| 0 |
4 |
| 1 |
9 |
|
|
1 |
|
|
0 |
|
|
1 |
|
|
4 |
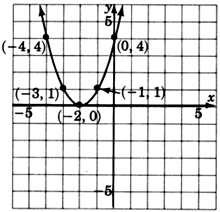
Notice that the graph of
is precisely the graph of
but translated 2 units to the left. The +2 inside the parentheses moves
two units to the left. A negative value inside the parentheses makes a move to the right.
Got questions? Get instant answers now!
Practice set b
Exercises
For the following problems, graph the quadratic equations.
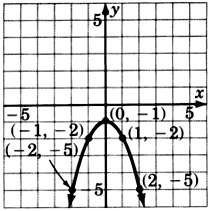
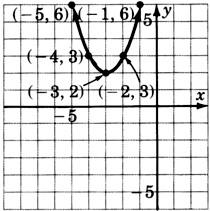
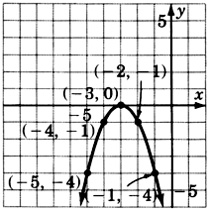
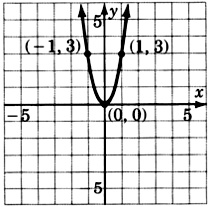
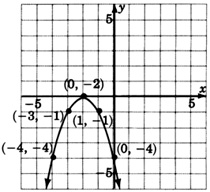
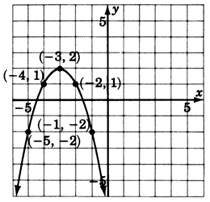
For the following problems, try to guess the quadratic equation that corresponds to the given graph.
Exercises for review