

| << Chapter < Page | Chapter >> Page > |
We will also assume that we know that structure of an atom, with a tiny, massive, positively charged nucleus surrounded by a much larger empty space in which electrons move. The positive charge on the nucleus is equal to the number of protons in the nucleus and, in a neutral atom, is also equal to the number of electrons moving about the nucleus. The number, called the atomic number, is unique for each type of atom. No two elements have the same atomic number, and amongst the naturally occurring elements, no atomic number is skipped: for every integer up to 118 we know an element with that atomic number. We will assume knowledge of the concept of electron shells as a means of understanding the Periodic Law, which describes the chemical and physical properties of the elements.
From the previous Concept Development Studies, we shall also assume an understanding of Coulomb’s Law to describe the interactions of the protons and electrons in an atom. And we shall also assume an understanding that light, or electromagnetic radiation, can be described in terms of the frequency of the light and that the frequencies emitted by a light source can be separated by using a prism or diffraction grating. We will use each of these understandings as we probe into greater detail about the structures of atoms.
In the Concept Development Study on Atomic Structure, we discussed the experimental method called “spectroscopy.” In general in a spectroscopy experiment, we look at the frequencies of light that an atom or molecule emits when energy is added to it in some way (commonly by heating it or placing it in an electric arc but possibly also by shining light on it). Alternatively, we can also look at the frequencies of light which the atom or molecule absorbs when we shine light with a range of frequencies on the atom or molecule. These two techniques are called “emission spectroscopy” and “absorption spectroscopy,” and which method is used depends on what properties we are trying to measure.
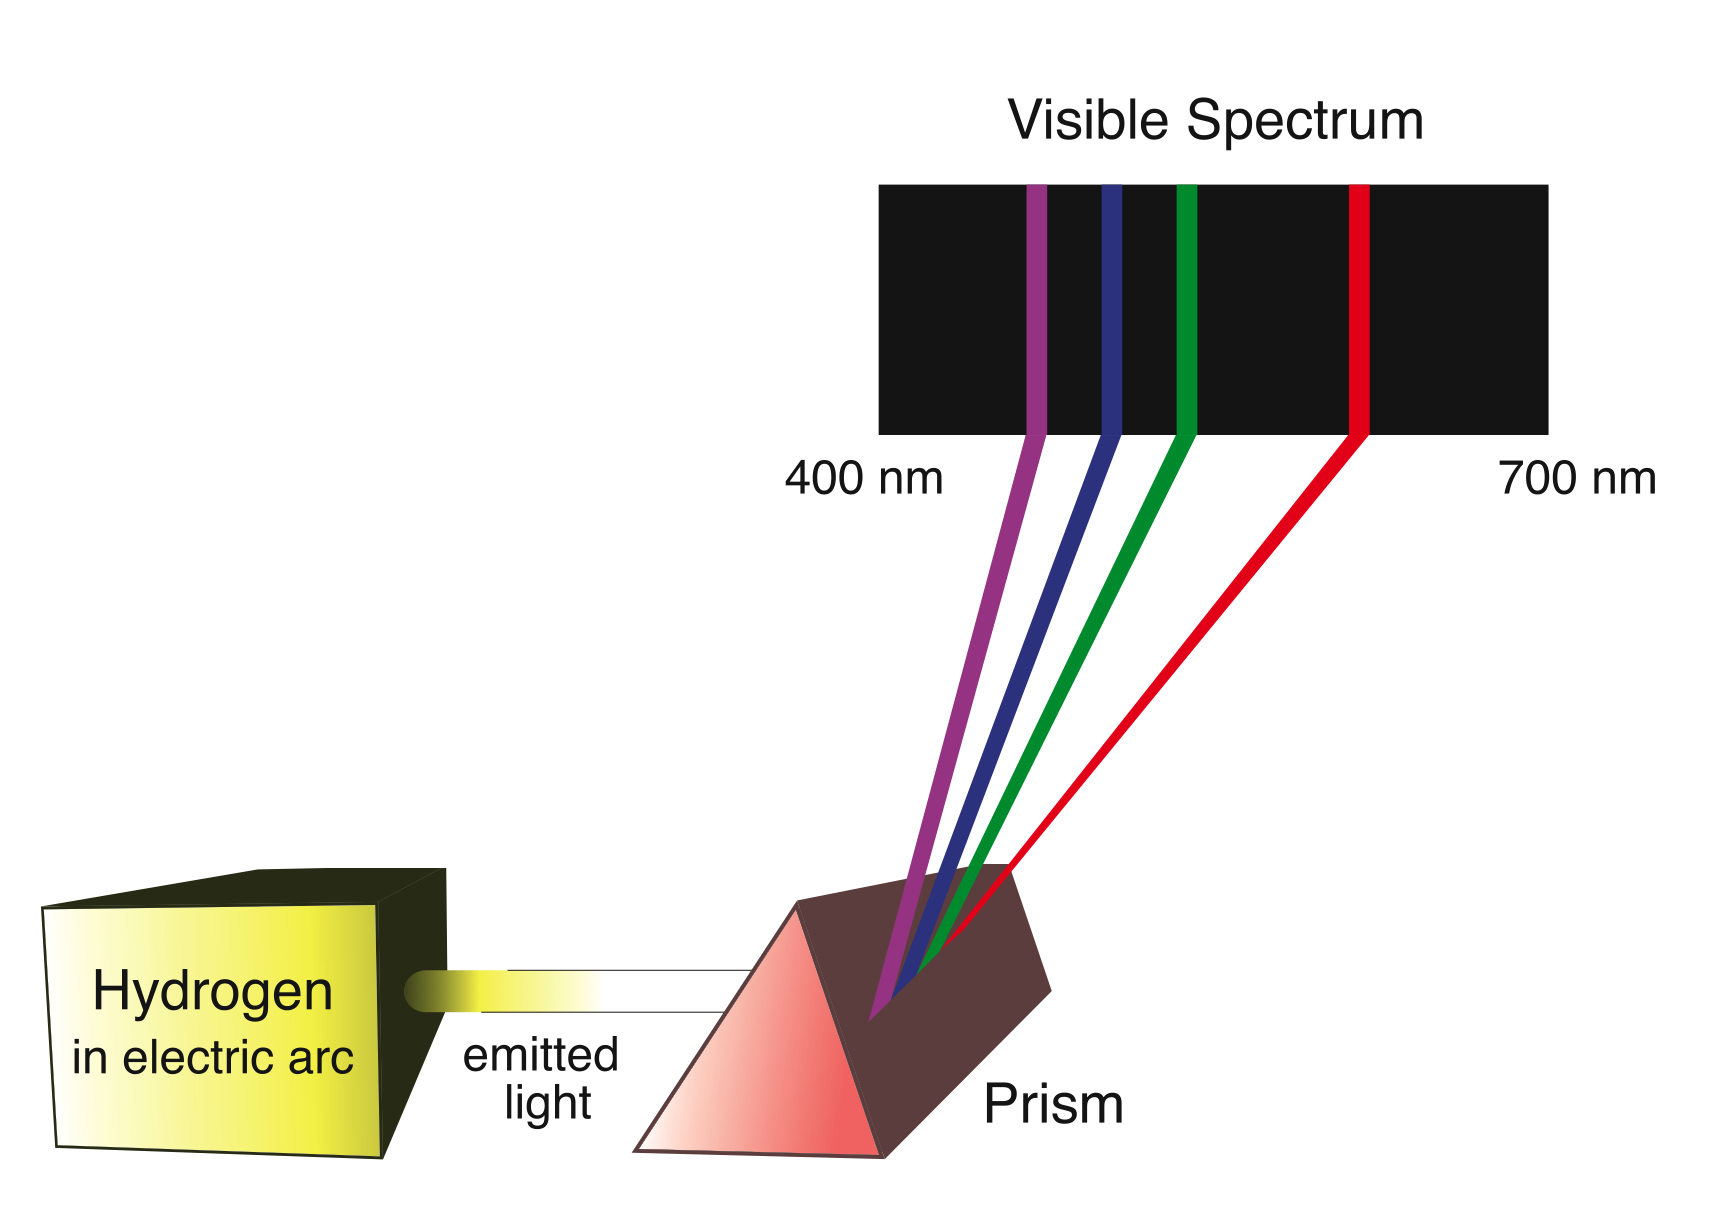
In the simple case of an atom, say hydrogen, the frequencies of light which the atom will absorb are the same as the frequencies of light which the atom will emit. We can look at either one, and the set of frequencies we see experimentally is called the “spectrum” of the atom. Since hydrogen is the simplest atom, with only a single proton and a single electron, we’ll look at hydrogen’s spectrum first.
The spectrum of hydrogen contains frequencies of light corresponding to visible light, ultraviolet light, and x-rays. The visible spectrum of hydrogen, which is just the four frequencies hydrogen emits that can be seen by the human eye, is shown in [link] . There are many more frequencies in hydrogen’s spectrum than the ones that we can see. [link] shows a set of these frequencies.
| Wavelength (nm) | Frequency (THz) | Region(color) |
| 94 | 3197 | Ultraviolet |
| 95 | 3157 | Ultraviolet |
| 97 | 3083 | Ultraviolet |
| 103 | 2922 | Ultraviolet |
| 122 | 2466 | Ultraviolet |
| 410 | 731 | Visible (violet) |
| 434 | 691 | Visible (violet-blue) |
| 486 | 617 | Visible (blue-green) |
| 656 | 457 | Visible (red) |
| 955 | 314 | Infrared |
| 1005 | 298 | Infrared |
| 1094 | 274 | Infrared |
| 1282 | 234 | Infrared |
| 1875 | 160 | Infrared |
Notification Switch
Would you like to follow the 'Concept development studies in chemistry 2012' conversation and receive update notifications?

|
|

|
|

|
|

|
|

|
|

|
|

|
|

|
|
|
|
|
|
|