

| << Chapter < Page | Chapter >> Page > |
In this section, we will learn the basics of Simulink and build a simple system.
For help on "Simulink" click here . For the following sections download the file Lab3Utilities.zip .
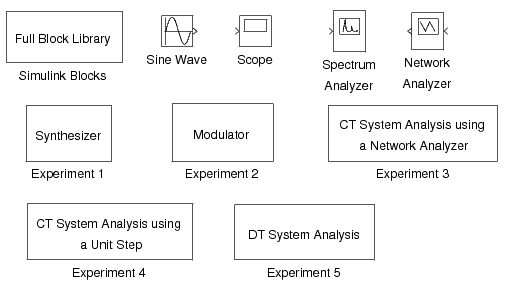
To get the library of Simulink functions for this laboratory, download the file Lab3Utilities.zip . Once Matlab is started, type “Lab3” to bring up the libraryof Simulink components shown in [link] . This library contains a full library of Simulink blocks,a spectrum analyzer and network analyzer designed for this laboratory, a sine wave generator, a scope,and pre-design systems for each of the experiments that you will be running.
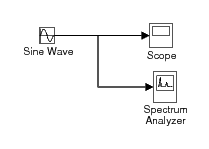
In order to familiarize yourself with Simulink, you will first build the system shown in [link] . This system consists of a sine wave generatorthat feeds a scope and a spectrum analyzer.
New option
from the
File pull-down menu, and select
Model .Sine Wave ,
Scope ,
and
Spectrum Analyzer blocks
from the
Lab3 window into the new window you created.Sine Wave and drag it to the input of the
Scope .
Now use the right button to click on the line you just created, and dragto the input of the
Spectrum Analyzer block.
Your system should now look like
[link] .Scope block to make the plotting
window for the scope appear.Configuration Parameters from
the
Simulation pull-down menu. Under the
Solver tab, set the
Stop time to 50, and the
Max step size to 0.02. Then select
OK . This will
allow the Spectrum Analyzer to make a more accurate calculation.Start option from
the
Simulation pull-down menu.
A standard Matlab figure window will pop up showingthe output of the
Spectrum Analyzer .5*pi rad/sec by double clicking on the
Sine Wave icon and changing the
number in the
Frequency field.
Restart the simulation. Observe the change in the waveform andits spectral density. If you want to change the time scaling in the plot
generated by the spectrum analyzer, from the Matlab prompt use the
subplot(2,1,1) and
axis() commands.Close option
from the
File pull-down menu.For help on the following topics select the corresponding link: simulink or printing figures in Simulink .
In this section, we will study the use and properties of the continuous-time Fourier transform with Simulink.The Simulink package is especially useful for continuous-time systems because it allows thesimulation of their behavior on a digital computer.
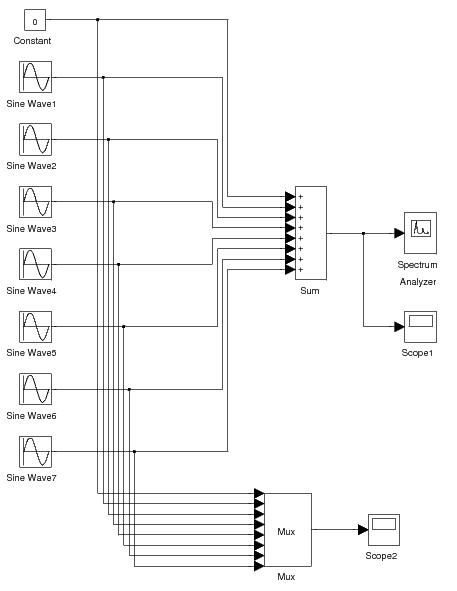
Double click the icon labeled
Synthesizer to bring up a model as shown in
[link] .
This system may be used to synthesize periodic signals byadding together the harmonic components of a Fourier series
expansion.Each
Sin Wave block can be set to a specific frequency,amplitude and phase.
The initial settings of the
Sin Wave blocks are set
to generate the Fourier series expansion
Notification Switch
Would you like to follow the 'Purdue digital signal processing labs (ece 438)' conversation and receive update notifications?

|
|

|
|

|
|

|
|

|
|

|
|
|
|
|

|
|

|
|

|