

| << Chapter < Page | Chapter >> Page > |
Probability Statement:
(Always a right-tailed test)
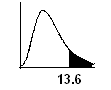
Since -value , we do not reject .
We conclude that there is not sufficient evidence to reject the null hypothesis. It appears that the number of teenage motor vehicle deaths fits a uniform distribution. It does not matter what time of the day or night it is. Teenagers die from motor vehicle accidents equally at any time of the day or night. However, if the level of significance were 10%, we would reject the null hypothesis and conclude that the distribution of deaths does not fit a uniform distribution.
A test of independence compares two factors to determine if they are independent (i.e. one factor does not affect the happening of a second factor).
The following table shows a random sample of 100 hikers and the area of hiking preferred.
| Gender | The Coastline | Near Lakes and Streams | On Mountain Peaks |
|---|---|---|---|
| Female | 18 | 16 | 11 |
| Male | 16 | 25 | 14 |
The distribution for the hypothesis test is .
The df's are equal to:
The chi-square statistic is calculated using
Each expected (E) value is calculated using
The first expected value (female, the coastline) is
The expected values are: 15.3, 18.45, 11.25, 18.7, 22.55, 13.75
The chi-square statistic is:
Probability Statement: -value (A right-tailed test)
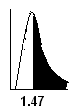
Since is less than 0.05, we do not reject the null.
There is not sufficient evidence to conclude that gender and hiking preference are not independent.
Sometimes you might be interested in how something varies. A test of a single variance is the type of hypothesis test you could run in order to determine variability.
A vending machine company which produces coffee vending machines claims that its machine pours an 8 ounce cup of coffee, on the average, with a standard deviation of 0.3 ounces. A college that uses the vending machines claims that the standard deviation is more than 0.3 ounces causing the coffee to spill out of a cup. The college sampled 30 cups of coffee and found that the standard deviation was 1 ounce. At the 1% level of significance, test the claim made by the vending machine company.
The distribution for the hypothesis test is where .
The test statistic
Probability Statement:
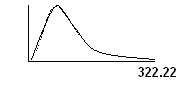
Since -value , reject .
There is sufficient evidence to conclude that the standard deviation is more than 0.3 ounces of coffee. The vending machine company needs to adjust their machines to prevent spillage.
Notification Switch
Would you like to follow the 'Collaborative statistics teacher's guide' conversation and receive update notifications?

|
|

|
|

|
|

|
|

|
|

|
|

|
|
|
|
|
|
|
|

|